Fee-related earnings (FRE) are the main source of income for alternative asset managers. Management fees are derived from long-term locked-up capital and result in earnings streams that tend to be largely insulated from wider market movements. Over 2018-21, sector FRE grew at a 26% CAGR with the sector FRE margin stable at 53%.
Yet, as the Citi analysts point out, the sector landscape is not without its challenges, actual and potential:
-
Fundraising – Sector AuM and profit growth are based on fundraising efforts. A step-change in demand for the asset class and/or a reduced ability to deploy capital could in theory impact or delay managers’ ability to raise capital for future funds.
-
Competition – Strong growth in private markets has naturally led to an increase in competition, which could impact on future fundraising.
-
Exit Environment – Investment exits are fundamental to crystallise returns. This is a challenge when markets are falling or unusually volatile.
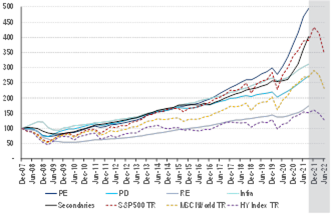
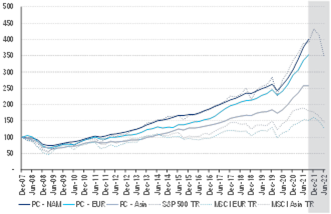
The charts below show the returns of certain asset classes since the GFC.
|
Asset Class Cum. Returns (2007 = 100) |
Region Private Capital Cum. Returns Vs Equity Markets (2007 = 100) |
|
|
|
|
© 2022 Citigroup Inc. No redistribution without Citigroup’s written permission. |
© 2022 Citigroup Inc. No redistribution without Citigroup’s written permission. |
|
Source: Preqin, DataStream, Citi Research |
Source: Preqin, DataStream, Citi Research |
Private Markets Asset Class IRRs By Vintage Year (2009-18) |
|
|
|
© 2022 Citigroup Inc. No redistribution without Citigroup’s written permission. |
|
Source: McKinsey, Burgiss, Citi Research |
-
Private Equity Historically the Best Performing Asset Class – The period post-GFC has been characterised by easy and cheap money. Globally between end-2007 and 3Q21, public and private markets significantly increased in value. Valuation growth, performance, and returns of private assets slightly outpaced those of public markets. Private equity was the best performing and returning asset class, followed by secondaries.
-
Returns of Private and Public Assets Have Been Highly Correlated – Over 2008-3Q21, according to Citi analysts, returns from private equity had a 99% correlation with those of the S&P 500 and a 98% correlation with those of the MSCI AW.
-
Returns Led By North America – Over the period, aggregate private assets (of which approx. c65% is private equity, c12% real estate, and c12% private debt) in North America had the biggest increase (4.0x return), closely followed by Europe (c3.5x).
|
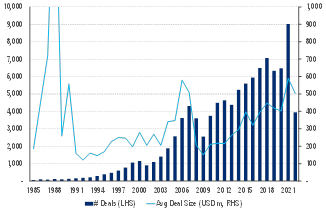
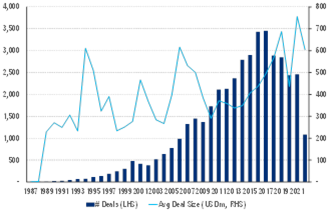
Private Equity – # Deals & Average Deal Size |
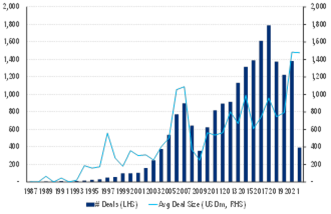
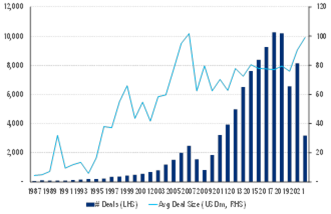
Private Debt – # Deals & Average Deal Size |
|
|
|
|
© 2022 Citigroup Inc. No redistribution without Citigroup’s written permission. Source: McKinsey, Citi Research |
© 2022 Citigroup Inc. No redistribution without Citigroup’s written permission. Source: Preqin, Citi Research |
|
Infrastructure – # Deals & Average Deal Size |
Real Estate – # Deals & Average Deal Size |
|
|
|
|
© 2022 Citigroup Inc. No redistribution without Citigroup’s written permission. |
© 2022 Citigroup Inc. No redistribution without Citigroup’s written permission. |
|
Source: Preqin, Citi Research |
Source: Preqin, Citi Research |
Over 2010-20, the median US buyout entry multiple, for example, increased from 9.0x to 13.1x EBITDA, while data from Baird suggest that over 2018-21 the average entry EBITDA multiple in Europe rose from 12x to 15x.
In 2020, there was a higher proportion of deals in higher-multiple sectors, such as tech, while 2021 saw an increase in deals in lower-multiple sectors, such as manufacturing, as sellers had previously been reluctant to exit. For more information on this subject, please see Western Europe Brokers & Asset Managers.
Citi Global Insights (CGI) is Citi’s premier non-independent thought leadership curation. It is not investment research; however, it may contain thematic content previously expressed in an Independent Research report. For the full CGI disclosure, click here.
