
Second Quarter 2019 Results and Key Metrics
HIGHLIGHTS
- Net Income of $4.8 Billion ($1.95 per Share)
- Revenues of $18.8 Billion
- Returned $4.6 Billion of Capital to Common Shareholders
- Repurchased 54 Million Common Shares
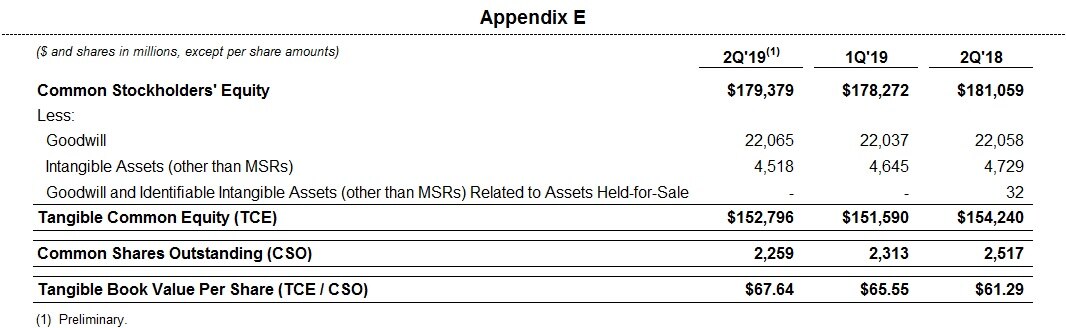
- Book Value per Share of $79.40
- Tangible Book Value per Share of $67.645
Read the full press release with tables and CEO commentary.
View the Financial Supplement (PDF)
View Financial Supplement (Excel)
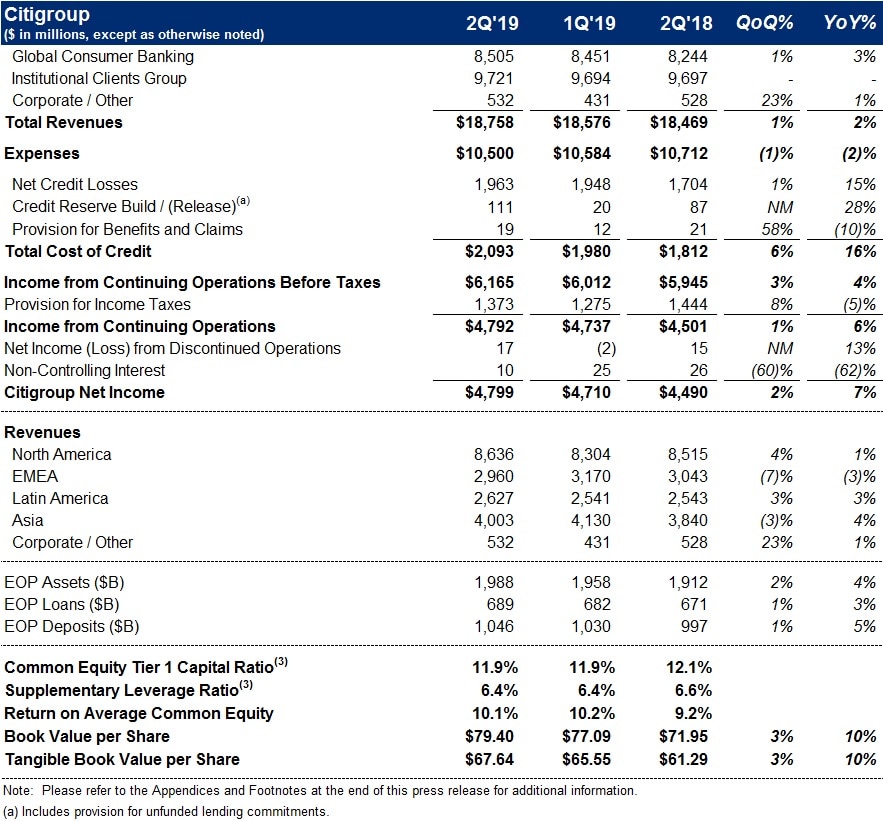
New York – Citigroup Inc. today reported net income for the second quarter 2019 of $4.8 billion, or $1.95 per diluted share, on revenues of $18.8 billion. This compared to net income of $4.5 billion, or $1.63 per diluted share, on revenues of $18.5 billion for the second quarter 2018.
Revenues increased 2% from the prior-year period, reflecting an approximately $350 million pre-tax gain on Citi's investment in Tradeweb (an electronic trading platform) within Fixed Income Markets and higher revenues across Global Consumer Banking (GCB), partially offset by declines in Investment Banking and Fixed Income and Equity Markets revenues, as well as mark-to-market losses on loan hedges6. Net income increased 7% from the prior-year period, driven by the higher revenues, a reduction in expenses and a lower effective tax rate, partially offset by higher cost of credit. Earnings per share of $1.95 increased 20% from the prior-year period including the gain. Excluding the Tradeweb gain7, earnings per share of $1.83 increased 12% primarily driven by a 10% reduction in average diluted shares outstanding and the lower effective tax rate.
Citi CEO Michael Corbat said, "Our earnings per share of $1.95 for the second quarter were 20% higher than one year ago. We navigated an uncertain environment successfully by executing our strategy, and by showing disciplined expense, credit and risk management. We increased our Return on Assets year-over-year to 97 basis points; and generated a Return on Tangible Common Equity of 11.9%, over 100 basis points better than last year. We delivered positive operating leverage for the 11th straight quarter and improved our efficiency, while again increasing loans and deposits. We have good momentum and solid growth across our consumer franchise, particularly in the U.S., while in the ICG, our industry leading Treasury and Trade Solutions business continues to perform well and we gained share in market-sensitive products such as Investment Banking.
"During the quarter, we received a non-objection from the Federal Reserve for our 2019 CCAR submission. That will allow us to meet the goal we set at Investor Day to return at least $60 billion in capital over three CCAR cycles. Our $21.5 billion capital return will raise the three-year total to $62.3 billion. Buybacks have reduced our common shares outstanding by 10% over the last year alone and helped drive our Tangible Book Value per share up 10% over the same time period. We remain committed to improve our returns on capital while continuing to provide meaningful capital return to our shareholders," Mr. Corbat concluded.
Percentage comparisons throughout this press release are calculated for the second quarter 2019 versus the second quarter 2018, unless otherwise specified.
Citigroup
Citigroup revenues of $18.8 billion in the second quarter 2019 increased 2%, reflecting the higher revenues across GCB, while Institutional Clients Group (ICG) revenues were largely unchanged.
Citigroup operating expenses of $10.5 billion in the second quarter 2019 decreased 2%, driven by efficiency savings and the wind-down of legacy assets, partially offset by continued investments and volume-driven growth.
Citigroup cost of credit of $2.1 billion in the second quarter 2019 increased 16%, driven by volume growth and seasoning in Citi-Branded Cards and Citi Retail Services in North America GCB as well as credit normalization in ICG.
Citigroup net income of $4.8 billion in the second quarter 2019 increased 7%, driven by the higher revenues, the reduction in expenses and the lower effective tax rate, partially offset by the higher cost of credit. Citigroup's effective tax rate was 22% in the current quarter compared to 24% in the second quarter 2018.
Citigroup's allowance for loan losses was $12.5 billion at quarter end, or 1.82% of total loans, compared to $12.1 billion, or 1.81% of total loans, at the end of the prior-year period. Total non-accrual assets declined 9% from the prior-year period to $3.7 billion. Consumer non-accrual loans declined 7% to $2.2 billion and corporate non-accrual loans declined 13% to $1.4 billion.
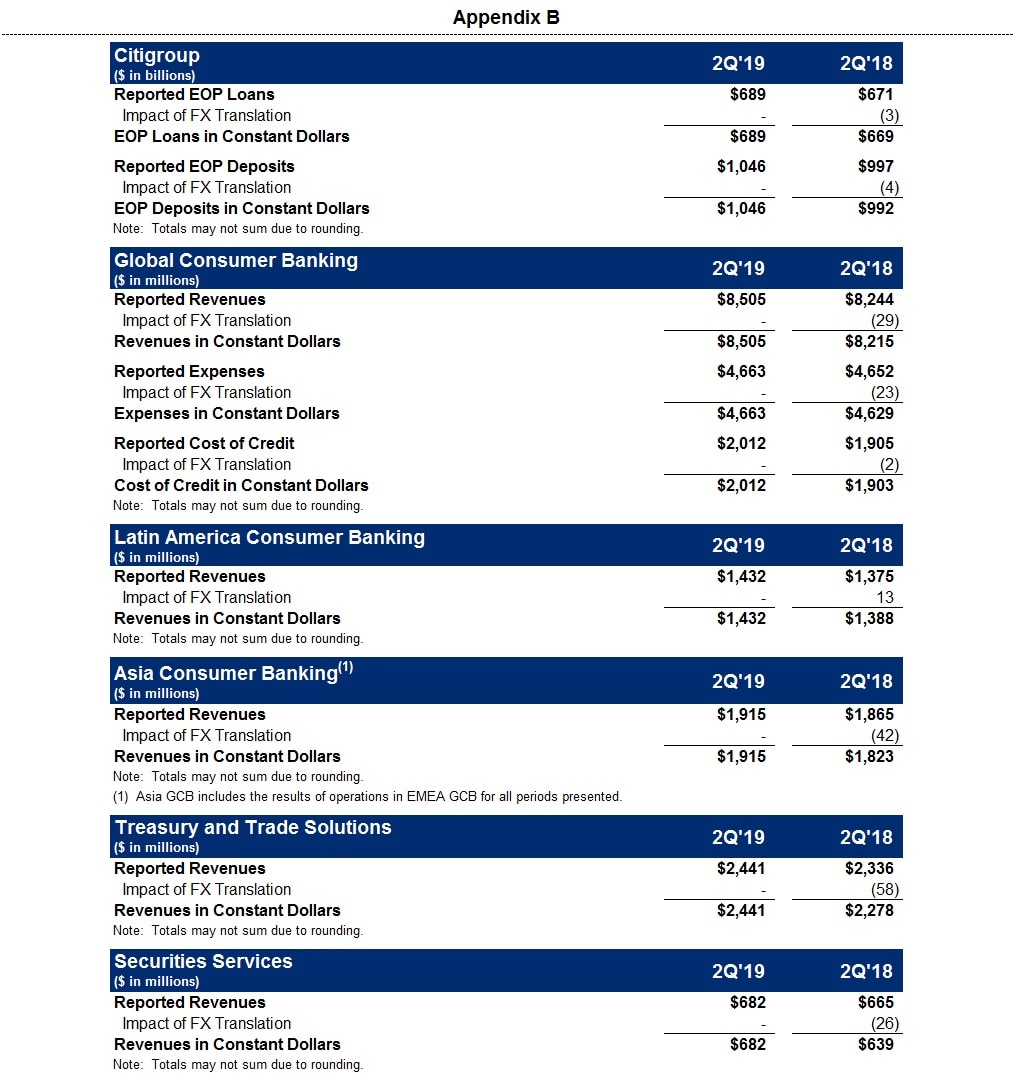
Citigroup's end-of-period loans were $689 billion as of quarter end, up 3% from the prior-year period on both a reported basis and excluding the impact of foreign exchange translation8. The increase on a constant dollar basis was driven by 4% aggregate growth in ICG and GCB, partially offset by the continued wind-down of legacy assets in Corporate / Other.
Citigroup's end-of-period deposits were $1.0 trillion as of quarter end, an increase of 5% from the prior-year period on both a reported and a constant dollar basis. The increase on a constant dollar basis was driven by 6% growth in ICG and 3% growth in GCB.
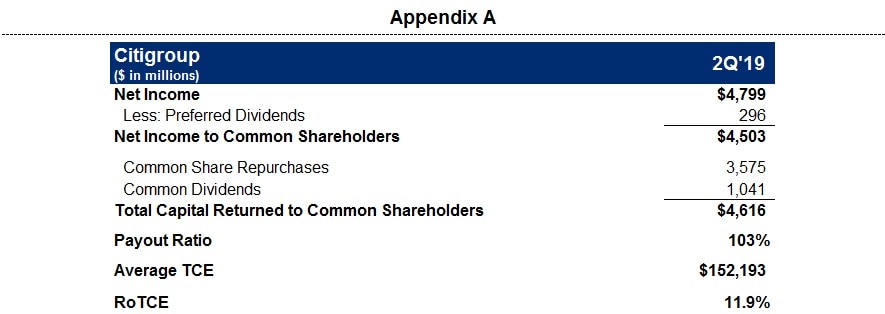
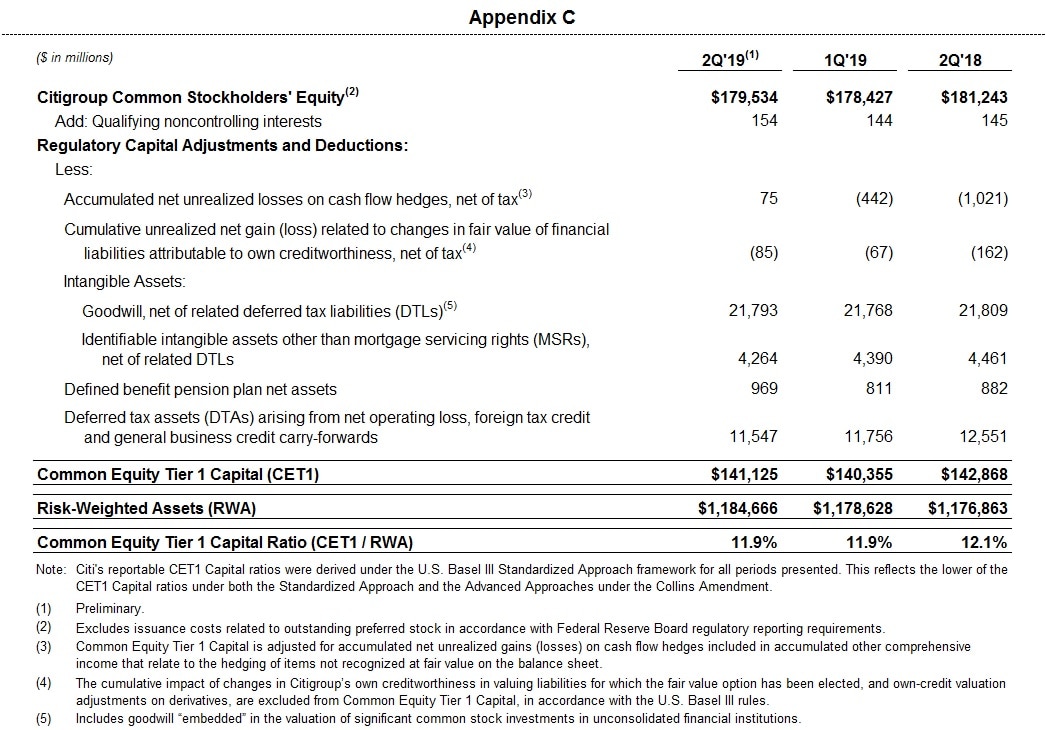
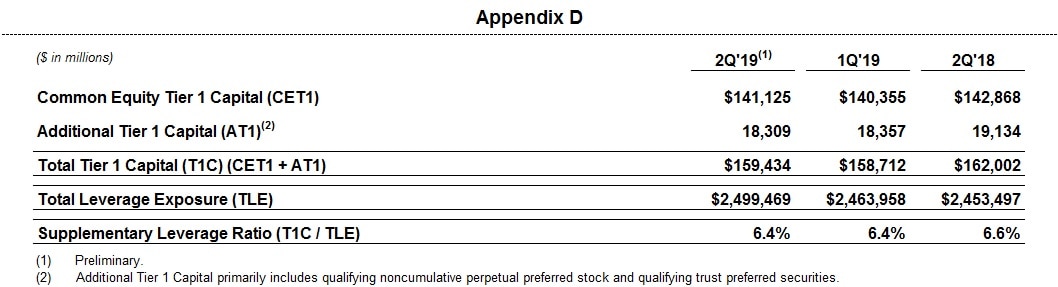
Citigroup's book value per share of $79.40 and tangible book value per share of $67.64, both as of quarter end, increased 10% from the prior year, driven by net income and the lower share count. At quarter end, Citigroup's CET1 Capital ratio was 11.9%, unchanged from the prior quarter, as net income was offset by common share repurchases and dividends. Citigroup's SLR for the second quarter 2019 was 6.4%, unchanged from the prior quarter. During the second quarter 2019, Citigroup repurchased 54 million common shares and returned a total of $4.6 billion to common shareholders in the form of common share repurchases and dividends.
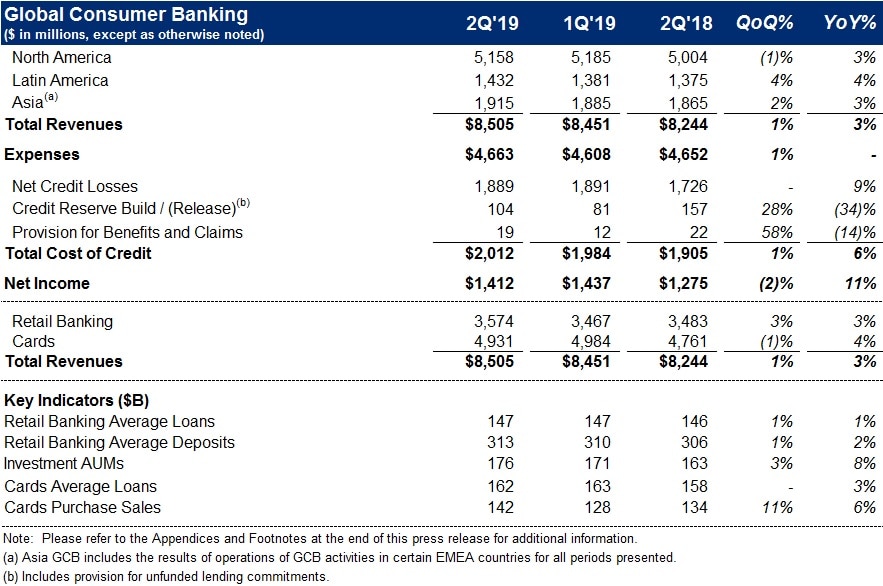
Global Consumer Banking
GCB revenues of $8.5 billion increased 3% on a reported basis and 4% in constant dollars, driven by growth in all three regions.
North America GCB revenues of $5.2 billion increased 3%. Retail Banking revenues of $1.4 billion remained largely unchanged. Excluding mortgage, Retail Banking revenues increased 1%, as improved growth in deposit volumes was partially offset by lower deposit spreads in commercial banking. Citi-Branded Cards revenues of $2.2 billion increased 7%, primarily driven by continued growth in interest-earning balances. Citi Retail Services revenues of $1.6 billion increased 1%, driven by loan growth, partially offset by higher contractual partner payments.
Latin America GCB revenues of $1.4 billion increased 4% on a reported basis and 3% in constant dollars. On this basis, and excluding revenues associated with an asset management business in Mexico that was sold in the third quarter 2018, revenues increased 5%, primarily driven by an increase in cards revenues and improved deposit spreads.
Asia GCB revenues of $1.9 billion increased 3% on a reported basis and 5% in constant dollars. On this basis, and excluding a gain from a building sale, revenues increased 3%, driven by higher deposit revenues as well as a recovery in investment revenues.
GCB operating expenses of $4.7 billion were largely unchanged on a reported basis. In constant dollars, expenses increased 1%, as continued investments and volume-driven expenses more than offset efficiency savings.
GCB cost of credit oof $2.0 billion increased 6% on both a reported and a constant dollar basis. The increase in constant dollars was driven by a 10% increase in net credit losses, primarily reflecting volume growth and seasoning in Citi-Branded Cards and Citi Retail Services in North America GCB, partially offset by a lower net loan loss reserve build.
GCB net income of $1.4 billion increased 11% on both a reported and a constant dollar basis, driven by the higher revenues and a lower effective tax rate, partially offset by the higher cost of credit.
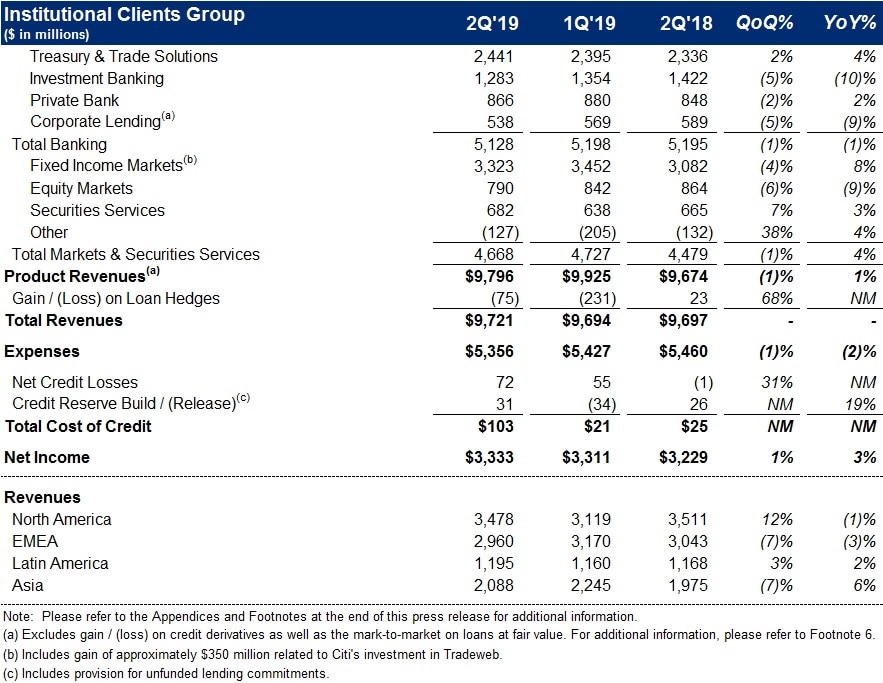
Institutional Clients Group
ICG revenues of $9.7 billion were largely unchanged, as the Tradeweb gain and growth in Treasury and Trade Solutions revenues offset declines in Investment Banking and Fixed Income and Equity Markets revenues, as well as mark-to-market losses on loan hedges.
Banking revenues of $5.1 billion decreased 3% (including gain / (loss) on loan hedges)6. Treasury and Trade Solutions revenues of $2.4 billion increased 4% on a reported basis and 7% in constant dollars, reflecting continued strong client engagement, with growth in deposits, transaction volumes and trade spreads. Investment Banking revenues of $1.3 billion decreased 10% but outperformed the market wallet. Advisory revenues decreased 36% to $232 million, equity underwriting revenues decreased 6% to $314 million and debt underwriting revenues increased 2% to $737 million. Private Bank revenues of $866 million increased 2%, reflecting growth with new and existing clients, which drove higher lending and deposit volumes, as well as growth in assets under management, partially offset by spread compression. Corporate Lending revenues of $538 million decreased 9% (excluding gain / (loss) on loan hedges), reflecting lower spreads and higher hedging costs.
Markets and Securities Services revenues of $4.7 billion increased 4%. Fixed Income Markets revenues of $3.3 billion increased 8% including the Tradeweb gain. Excluding the gain, Fixed Income Markets declined 4% reflecting a challenging trading environment, particularly in rates. Equity Markets revenues of $790 million decreased 9%, primarily reflecting lower client activity in cash equities and prime finance, partially offset by strong corporate client activity in derivatives. Securities Services revenues of $682 million increased 3% on a reported basis and 7% in constant dollars, reflecting higher rates, as well as an increase in client activity.
ICG net income of $3.3 billion increased 3%, primarily driven by a decrease in expenses and a lower effective tax rate partially offset by an increase in cost of credit. ICG operating expenses decreased 2% to $5.4 billion, as efficiency savings more than offset investments and volume-driven growth. ICG cost of credit included net credit losses of $72 million (net recovery of $1 million in the prior-year period) and a net loan loss reserve build of $31 million (net loan loss reserve build of $26 million in the prior-year period).

Corporate / Other
Corporate / Other revenues of $532 million increased 1%, as higher treasury revenues and gains were largely offset by the wind-down of legacy assets.
Corporate / Other expenses of $481 million decreased 20%, primarily driven by the wind-down of legacy assets.
Corporate / Other loss from continuing operations before taxes of $73 million increased from $46 million in the prior-year period, as the lower expenses and higher revenues more than offset the lower benefit from cost of credit.
Citigroup will host a conference call today at 10 a.m. (ET). A live webcast of the presentation, as well as financial results and presentation materials, will be available at https://www.citigroup.com/global/investors. Dial-in numbers for the conference call are as follows: (866) 516-9582 in the U.S. and Canada; (973) 409-9210 outside of the U.S. and Canada. The conference code for both numbers is 1879538.
Additional financial, statistical, and business-related information, as well as business and segment trends, is included in a Quarterly Financial Data Supplement. Both this earnings release and Citigroup's Second Quarter 2019 Quarterly Financial Data Supplement are available on Citigroup's website at www.citigroup.com.
Citi
Citi, the leading global bank, has approximately 200 million customer accounts and does business in more than 160 countries and jurisdictions. Citi provides consumers, corporations, governments and institutions with a broad range of financial products and services, including consumer banking and credit, corporate and investment banking, securities brokerage, transaction services, and wealth management.
Additional information may be found at www.citigroup.com | Twitter: @Citi | YouTube: www.youtube.com/citi | Blog: http://blog.citigroup.com | Facebook: www.facebook.com/citi | LinkedIn: www.linkedin.com/company/citi
Certain statements in this release are "forward-looking statements" within the meaning of the rules and regulations of the U.S. Securities and Exchange Commission (SEC). These statements are based on management's current expectations and are subject to uncertainty and changes in circumstances. These statements are not guarantees of future results or occurrences. Actual results and capital and other financial condition may differ materially from those included in these statements due to a variety of factors, including, among others, the efficacy of Citi's business strategies and execution of those strategies, such as those relating to its key investment, efficiency and capital optimization initiatives, governmental and regulatory actions or approvals, various geopolitical and macroeconomic uncertainties, challenges and conditions, for example, changes in monetary policies and trade policies, and the precautionary statements included in this release and those contained in Citigroup's filings with the SEC, including without limitation the "Risk Factors" section of Citigroup's 2018 Form 10-K. Any forward-looking statements made by or on behalf of Citigroup speak only as to the date they are made, and Citi does not undertake to update forward-looking statements to reflect the impact of circumstances or events that arise after the date the forward-looking statements were made.
Contacts:
Press: Mark Costiglio (212) 559-4114
Investors: Elizabeth Lynn (212) 559-2718
Fixed Income Investors: Thomas Rogers (212) 559-5091
Click here for the complete press release and summary financial information.
1 Citigroup's total expenses divided by total revenues.
2 Preliminary. Citigroup's return on average tangible common equity (RoTCE) is a non-GAAP financial measure. RoTCE represents annualized net income available to common shareholders as a percentage of average tangible common equity (TCE). For the components of the calculation, see Appendix A.
3 Ratios as of June 30, 2019 are preliminary. For the composition of Citigroup's Common Equity Tier 1 (CET1) Capital and ratio, see Appendix C. For the composition of Citigroup's Supplementary Leverage Ratio (SLR), see Appendix D.
4 Citigroup's payout ratio is the sum of common dividends and common share repurchases divided by net income available to common shareholders. For the components of the calculation, see Appendix A.
5 Citigroup's tangible book value per share is a non-GAAP financial measure. For a reconciliation of this measure to reported results, see Appendix E.
6 Credit derivatives are used to economically hedge a portion of the corporate loan portfolio that includes both accrual loans and loans at fair value. Gains / (losses) on loan hedges includes the mark-to-market on the credit derivatives and the mark-to-market on the loans in the portfolio that are at fair value. The fixed premium costs of these hedges are netted against the corporate lending revenues to reflect the cost of credit protection. Citigroup's results of operations excluding the impact of gains / (losses) on loan hedges are non-GAAP financial measures.
7 Citigroup's results of operations excluding the impact of the Tradeweb gain (approximately $270 million after-tax) or the impact of any other gains or sales are non-GAAP financial measures.
8 Results of operations excluding the impact of foreign exchange translation (constant dollar basis) are non-GAAP financial measures. For a reconciliation of these measures to reported results, see Appendix B.