Second Quarter 2020 Results and Key Metrics
HIGHLIGHTS
- Net Income of $1.3 Billion ($0.50 per Share)
- Revenues of $19.8 Billion
- Returned $1.1 Billion of Capital to Common Shareholders
- Book Value per Share of $83.41
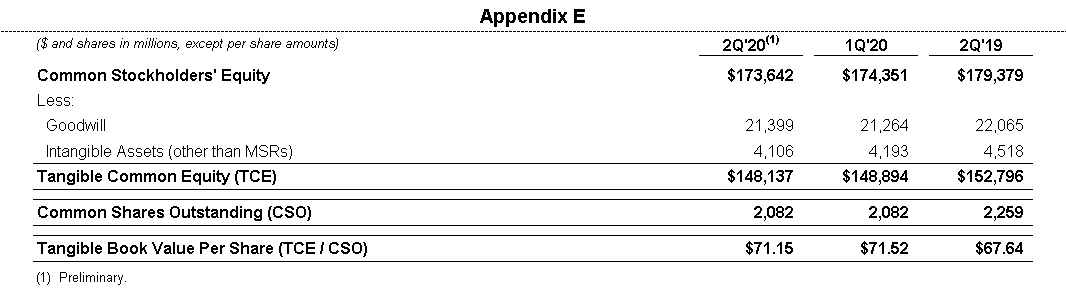
- Tangible Book Value per Share of $71.155
Read the full press release with tables and CEO commentary.
View the Financial Supplement (PDF)
View Financial Supplement (Excel)
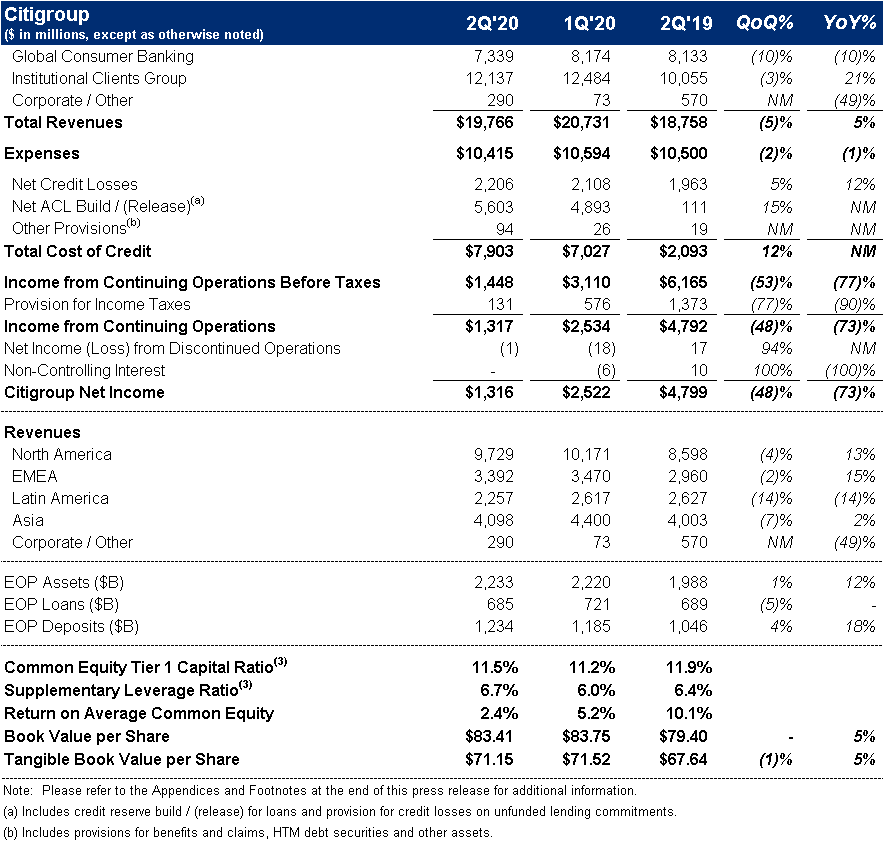
New York – Citigroup Inc. today reported net income for the second quarter 2020 of $1.3 billion, or $0.50 per diluted share, on revenues of $19.8 billion. This compared to net income of $4.8 billion, or $1.95 per diluted share, on revenues of $18.8 billion for the second quarter 2019.
Revenues increased 5% from the prior-year period, primarily reflecting higher revenues in Fixed Income Markets and Investment Banking, both in the Institutional Clients Group (ICG), partially offset by lower revenues in Global Consumer Banking (GCB). Net income declined 73% from the prior-year period, driven by substantially higher allowance for credit loss reserves (ACL), primarily reflecting the deterioration in Citi's view of the macroeconomic outlook since the end of the first quarter under the Current Expected Credit Loss standard (CECL), as well as downgrades in the corporate loan portfolio, in both cases driven by the continued impact of the COVID-19 pandemic. The reserve build also includes an additional qualitative management adjustment to reflect the potential for a higher level of stress and/or a somewhat slower economic recovery. Earnings per share of $0.50 decreased 74% from the prior-year period, reflecting the decline in net income.
Michael Corbat, Citi CEO, said, "While credit costs weighed down our net income, our overall business performance was strong during the quarter, and we have been able to navigate the COVID-19 pandemic reasonably well. The Institutional Clients Group had an exceptional quarter, marked by an increase in Fixed Income of 68%. Global Consumer Banking revenues were down as spending slowed significantly due to the pandemic.
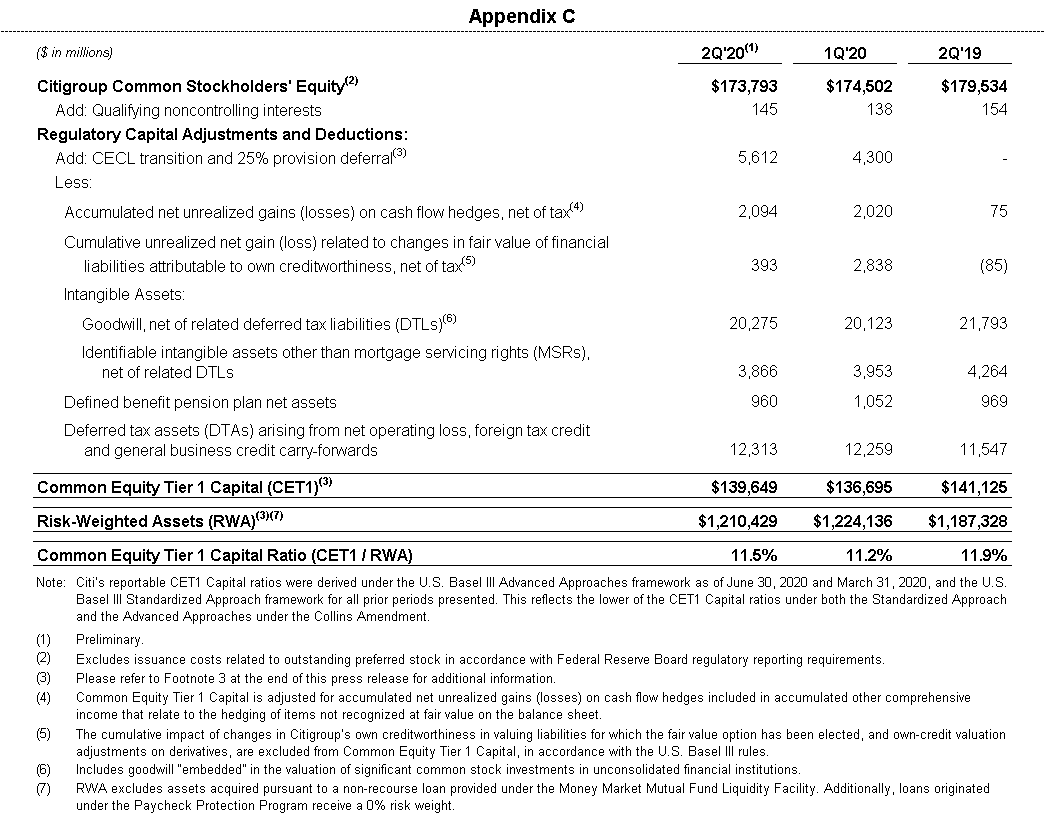
"We entered this crisis from a position of strength. During the quarter, our regulatory capital increased and our CET1 ratio improved to 11.5%, comfortably above our new regulatory minimum of 10%. We continued to add to our substantial levels of liquidity and our balance sheet has plenty of capacity to serve our clients. With a sharp emphasis on risk management, we are prepared for a variety of scenarios and will continue to operate our institution prudently given this unprecedented situation," Mr. Corbat concluded.
Percentage comparisons throughout this press release are calculated for the second quarter 2020 versus the second quarter 2019, unless otherwise specified.
Citigroup
Citigroup revenues of $19.8 billion in the second quarter 2020 increased 5%, primarily reflecting the higher revenues in Fixed Income Markets and Investment Banking, partially offset by the lower revenues in GCB.
Citigroup operating expenses of $10.4 billion in the second quarter 2020 decreased 1%, as efficiency savings and lower marketing and other discretionary spend more than offset higher compensation expense, investments and COVID-19 related expenses.
Citigroup cost of credit of $7.9 billion in the second quarter 2020 compared to $2.1 billion in the prior-year period, reflecting the ACL builds related to the deterioration in Citi's macroeconomic outlook since the end of the first quarter, the corporate loan downgrades and the qualitative management adjustment.
Citigroup net income of $1.3 billion in the second quarter 2020 declined 73%, driven by the higher cost of credit, partially offset by the higher revenues and a lower effective tax rate. Citigroup's effective tax rate was 9% in the current quarter compared to 22% in the second quarter 2019, reflecting a higher relative impact from tax advantaged investments and other tax benefit items this quarter given the lower level of pre-tax income.
Citigroup's allowance for credit losses on loans was $26.4 billion at quarter end, or 3.89% of total loans, compared to $12.5 billion, or 1.82% of total loans, at the end of the prior-year period. Total non-accrual assets grew 58% from the prior-year period to $5.9 billion. Consumer non-accrual loans declined 7% to $1.8 billion, while corporate non-accrual loans of $4.0 billion increased from $1.7 billion in the prior year period.
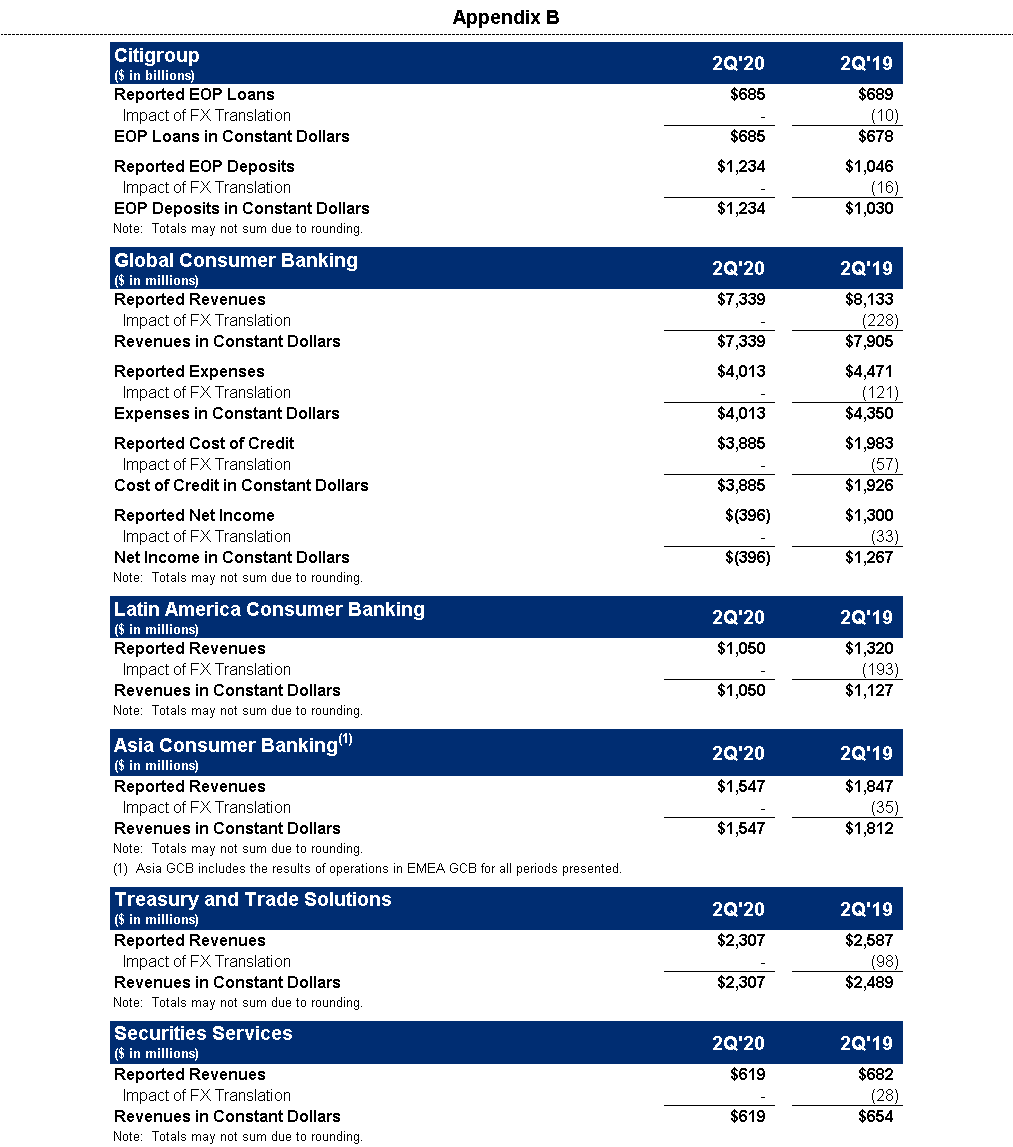
Citigroup's end-of-period loans were $685 billion as of quarter end, largely unchanged from the prior-year period. Excluding the impact of foreign exchange translation6, end-of-period loans grew 1%, driven by 5% growth in ICG, partially offset by lower loans in GCB and the continued wind-down of legacy assets in Corporate / Other.
Citigroup's end-of-period deposits were $1.2 trillion as of quarter end, an increase of 18% from the prior-year period. In constant dollars, Citigroup's end-of-period deposits increased 20%, driven by 15% growth in GCB and 22% growth in ICG.
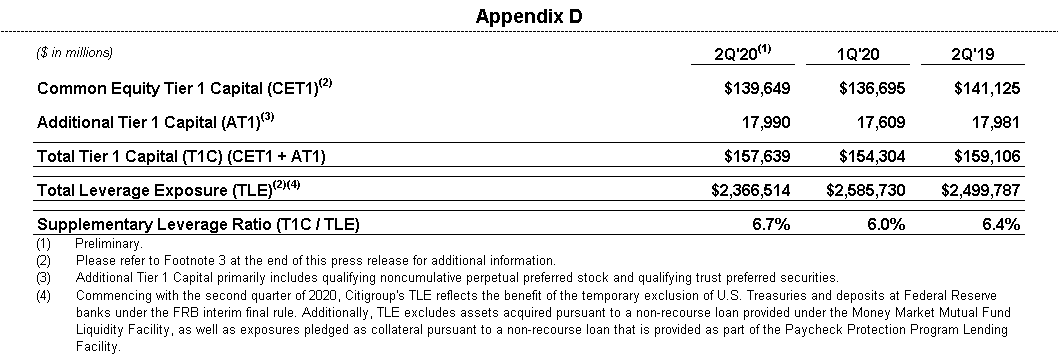
Citigroup's book value per share of $83.41 and tangible book value per share of $71.15 each increased 5% versus the prior-year period, driven by a reduction in common shares outstanding. At quarter end, Citigroup's CET1 Capital ratio was 11.5%, up from the prior quarter, primarily reflecting a decline in risk-weighted assets. Citigroup's SLR for the second quarter 2020 was 6.7%, an increase from the prior quarter. During the quarter, Citigroup returned a total of $1.1 billion to common shareholders in the form of dividends.
Global Consumer Banking
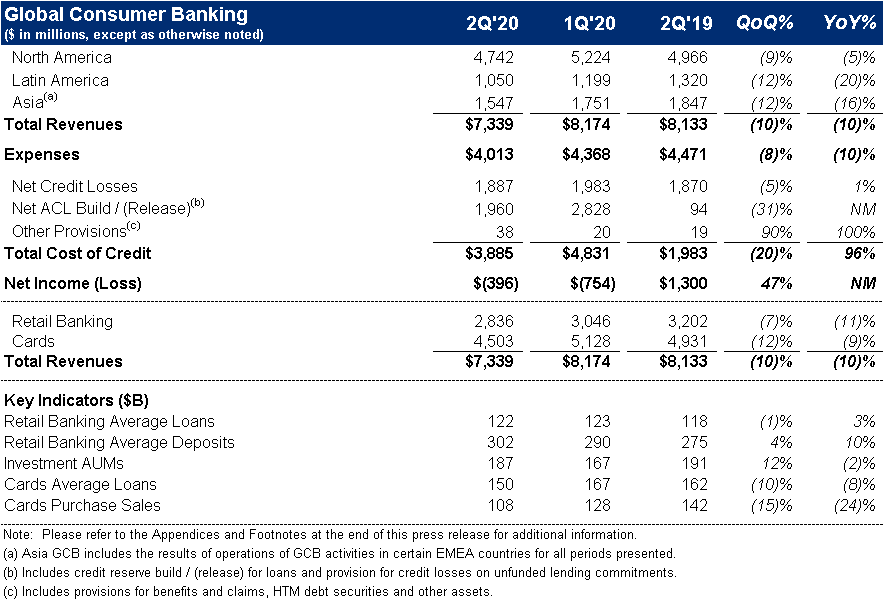
GCB revenues of $7.3 billion decreased 10% on a reported basis and 7% in constant dollars, as lower loan volumes and lower interest rates across all regions offset strong deposit growth, reflecting the continued impact of COVID-19.
North America GCB revenues of $4.7 billion decreased 5%. Citi-Branded Cards revenues of $2.2 billion increased 1%, as lower purchase sales and lower average loans were more than offset by a favorable mix shift toward interest earning balances, which supported net interest revenues. Citi Retail Services revenues of $1.4 billion decreased 13%, reflecting higher partner payments and lower average loans. Retail Banking revenues of $1.1 billion decreased 3%, as the benefit of stronger deposit volumes and improvement in mortgage revenues were more than offset by lower deposit spreads.
Latin America GCB revenues of $1.1 billion declined 20% on a reported basis and 7% in constant dollars, driven by lower card purchase sales, a decline in loan volumes and lower deposit spreads, partially offset by deposit growth.
Asia GCB revenues of $1.5 billion declined 16% on a reported basis and 15% in constant dollars, on lower card purchase sales and lower deposit spreads, even as deposit volume growth remained strong.
GCB operating expenses of $4.0 billion decreased 10% on a reported basis and 8% in constant dollars, as efficiency savings, lower volume-related expenses and reductions in marketing and other discretionary spending were partially offset by increases in COVID-19 related expenses.
GCB cost of credit of $3.9 billion increased significantly on a reported basis and in constant dollars. The increase reflects larger ACL builds related to the deterioration in Citi's macroeconomic outlook, partially offset by the impact of a change in accounting for third party collection fees.
GCB net loss of $(0.4) billion compared to income of $1.3 billion in the prior-year period, on a reported basis and in constant dollars, driven by the higher cost of credit and the lower revenues, partially offset by the lower expenses.
Institutional Clients Group
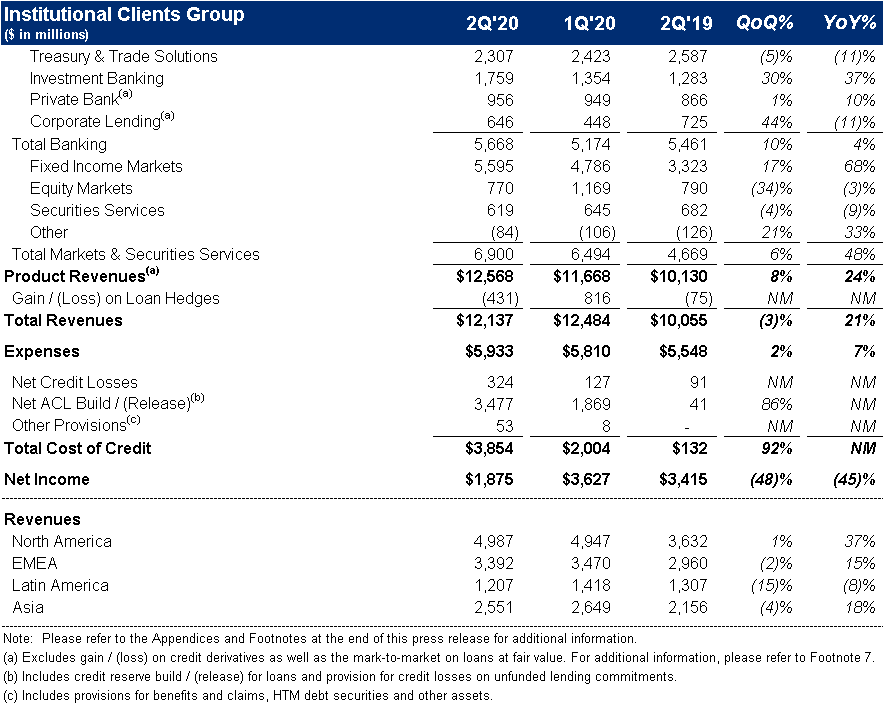
ICG revenues of $12.1 billion increased 21%, as strong performance in Fixed Income Markets, Investment Banking, and the Private Bank was partially offset by lower revenues in Treasury and Trade Solutions, Corporate Lending and Securities Services.
Banking revenues of $5.2 billion decreased 3% versus the prior year (including gain / (loss) on loan hedges)7. Treasury and Trade Solutions revenues of $2.3 billion declined 11% on a reported basis and 7% in constant dollars, as strong client engagement and growth in deposits were more than offset by the impact of lower interest rates and reduced commercial card spend. Investment Banking revenues of $1.8 billion increased 37%, with strong growth in debt and equity underwriting. Advisory revenues decreased 1% to $229 million, while equity underwriting revenues increased 56% to $491 million and debt underwriting revenues increased 41% to $1.0 billion. Private Bank revenues of $956 million increased 10% (excluding gain / (loss) on loan hedges), driven by increased capital markets activity, and higher lending and deposit volumes, partially offset by lower deposit spreads, reflecting the impact of lower rates. Corporate Lending revenues of $646 million declined 11% (excluding gain / (loss) on loan hedges), as higher loan volumes were more than offset by lower spreads.
Markets and Securities Services revenues of $6.9 billion increased 48%. Fixed Income Markets revenues of $5.6 billion increased 68%, reflecting strength in rates and currencies, spread products and commodities. Equity Markets revenues of $770 million decreased 3%, as solid performance in cash equities was more than offset by lower revenues in derivatives and prime finance, reflecting a more challenging environment. Securities Services revenues of $619 million decreased 9% on a reported basis and 5% in constant dollars, as higher deposit volumes were more than offset by lower spreads, given lower interest rates.
ICG net income of $1.9 billion decreased 45%, as the revenue growth was more than offset by higher cost of credit and expenses. ICG operating expenses increased 7% to $5.9 billion, as efficiency savings were more than offset by higher compensation costs, continued investments, and volume-driven growth. ICG cost of credit included net credit losses of $324 million, compared to $91 million in the prior-year period, and an ACL build of $3.5 billion compared to a build of $41 million in the prior-year period, reflecting the impact of a deterioration in Citi's macroeconomic outlook, as well as downgrades in the corporate loan portfolio.
Corporate / Other
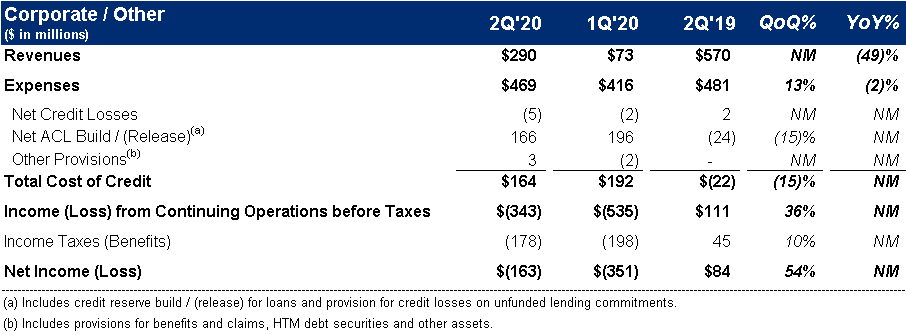
Corporate / Other revenues of $290 million decreased 49%, reflecting the wind-down of legacy assets and the impact of lower rates, partially offset by AFS gains as well as positive marks on legacy securities, as spreads tightened during the quarter.
Corporate / Other expenses of $469 million decreased 2%, as the wind-down of legacy assets was partially offset by higher infrastructure costs, as well as incremental costs associated with COVID-19.
Corporate / Other loss from continuing operations before taxes of $(343) million compared to income of $111 million in the prior-year period, driven by higher ACL builds on our legacy portfolio, and the lower revenues, partially offset by the decrease in expenses.
Citigroup will host a conference call today at 10:00 a.m. (ET). A live webcast of the presentation, as well as financial results and presentation materials, will be available at https://www.citigroup.com/global/investors. Dial-in numbers for the conference call are as follows: (866) 516-9582 in the U.S. and Canada; (973) 409-9210 outside of the U.S. and Canada. The conference code for both numbers is 4199384.
Additional financial, statistical and business-related information, as well as business and segment trends, is included in a Quarterly Financial Data Supplement. Both this earnings release and Citigroup's Second Quarter 2020 Quarterly Financial Data Supplement are available on Citigroup's website at www.citigroup.com.
Citi
Contacts: