First Quarter 2021 Results and Key Metrics
HIGHLIGHTS
- Net Income of $7.9 Billion ($3.62 per Share)
- Revenues of $19.3 Billion
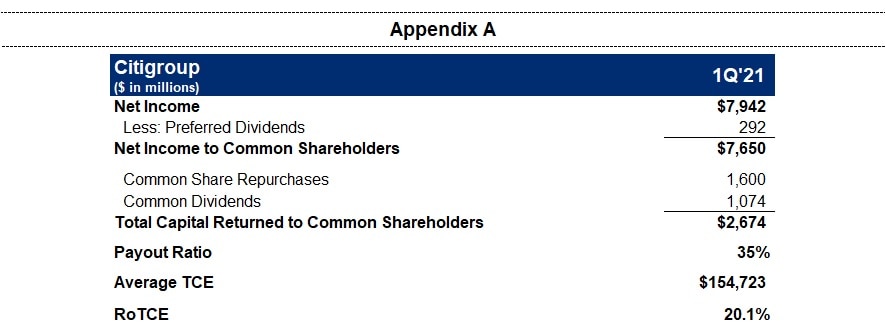
- Returned $2.7 Billion of Capital to Common Shareholders
- Repurchased 23 Million Common Shares
- Book Value per Share of $88.18
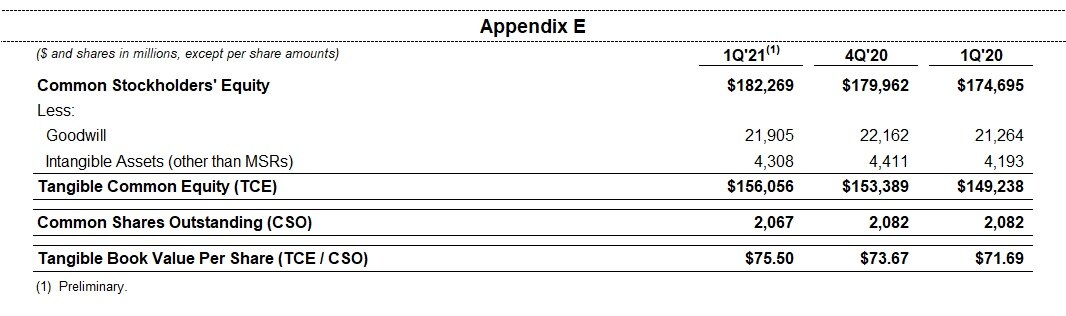
- Tangible Book Value per Share of $75.504
Read the full press release with tables and CEO commentary.
View the Financial Supplement (PDF)
View Financial Supplement (Excel)
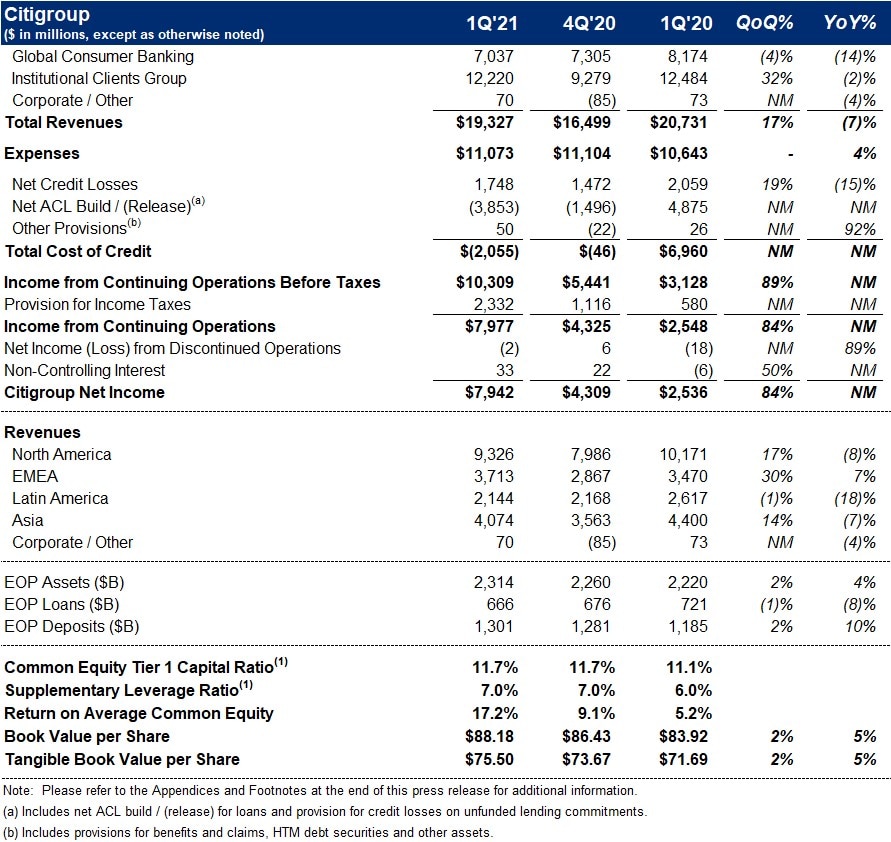
New York – Citigroup Inc. today reported net income for the first quarter 2021 of $7.9 billion, or $3.62 per diluted share, on revenues of $19.3 billion. This compared to net income of $2.5 billion, or $1.06 per diluted share, on revenues of $20.7 billion for the first quarter 2020.
Revenues decreased 7% from the prior-year period, as higher revenues in Investment Banking and Equity Markets were more than offset by lower rates, the absence of prior year mark-to-market gains on loan hedges within the Institutional Clients Group (ICG), and lower card volumes in Global Consumer Banking (GCB). Net income of $7.9 billion increased significantly from the prior-year period driven by the lower cost of credit. Earnings per share of $3.62 increased significantly from the prior-year period, reflecting the increase in net income, as well as a slight decline in shares outstanding.
Jane Fraser, Citi CEO, said, "It's been a better than expected start to the year, and we are optimistic about the macro environment. We are committed to serving our clients through the recovery and positioning the bank for a period of sustained growth.
"We reported record net income driven by strong performance in our Institutional Clients Group and a significant release from our Allowance for Credit Losses, as a result of the improving economic outlook. While Global Consumer Banking revenues were down quarter-over-quarter as a result of the pandemic, this is the healthiest we have seen the consumer emerge from a crisis in recent history.
"Our capital levels remained strong and stable, allowing us to respond to the needs of our clients and return capital to our shareholders. At 11.7%, our Common Equity Tier One Ratio was unchanged from the fourth quarter and we resumed the repurchase of common stock, which we had voluntarily paused at the onset of the pandemic."
Percentage comparisons throughout this press release are calculated for the first quarter 2021 versus the first quarter 2020, unless otherwise specified.
Strategic Actions: Global Consumer Banking
Citigroup today announced strategic actions in Global Consumer Banking—as part of an ongoing strategic review—which will allow Citi to direct investments and resources to the businesses where it has the greatest scale and growth potential. Citi will focus its Global Consumer Bank presence in Asia and EMEA on four wealth centers—Singapore, Hong Kong, the UAE and London. As a result, Citi intends to pursue exits from its consumer franchises in 13 markets across the two regions.
The affected businesses include the consumer franchises in Australia, Bahrain, China, India, Indonesia, Korea, Malaysia, the Philippines, Poland, Russia, Taiwan, Thailand and Vietnam. Citigroup's Institutional Clients Group will continue to serve clients in these markets, which remain important to Citi's global network.
Jane Fraser, Citi CEO, said, "As a result of the ongoing refresh of our strategy, we have decided that we are going to double down on wealth. We will operate our consumer banking franchise in Asia and EMEA solely from four wealth centers, Singapore, Hong Kong, UAE and London. This positions us to capture the strong growth and attractive returns the wealth management business offers through these important hubs.
"While the other 13 markets have excellent businesses, we don't have the scale we need to compete. We believe our capital, investment dollars and other resources are better deployed against higher returning opportunities in wealth management and our institutional businesses in Asia. We will continue to update you on strategic decisions as we make them while we work to increase the returns we deliver to our shareholders," Fraser concluded.
First Quarter Financial Results
Citigroup
Citigroup revenues of $19.3 billion in the first quarter 2021 decreased 7%, primarily reflecting lower revenues in GCB and ICG.
Citigroup operating expenses of $11.1 billion in the first quarter 2021 increased 4%, as continued investments in Citi's transformation, including infrastructure supporting Citi's risk and control environment, along with other strategic investments were partially offset by efficiency savings.
Citigroup cost of credit of $(2.1) billion in the first quarter 2021 compared to $7.0 billion in the prior-year period, largely reflecting a release of allowance for credit loss (ACL) reserves in ICG and GCB, driven by improvements in the macroeconomic outlook and lower loan volumes.
Citigroup net income of $7.9 billion in the first quarter 2021 compared to $2.5 billion in the prior-year period, driven by lower cost of credit. Citigroup's effective tax rate was 23% in the current quarter compared to 19% in the first quarter 2020.
Citigroup's allowance for credit losses on loans was $21.6 billion at quarter end, or 3.29% of total loans, compared to $20.4 billion, or 2.84% of total loans, at the end of the prior-year period. Total non-accrual assets grew 21% from the prior-year period to $5.1 billion. Consumer non-accrual loans increased 17% to $2.0 billion, while corporate non-accrual loans of $3.1 billion increased 25% from the prior-year period.
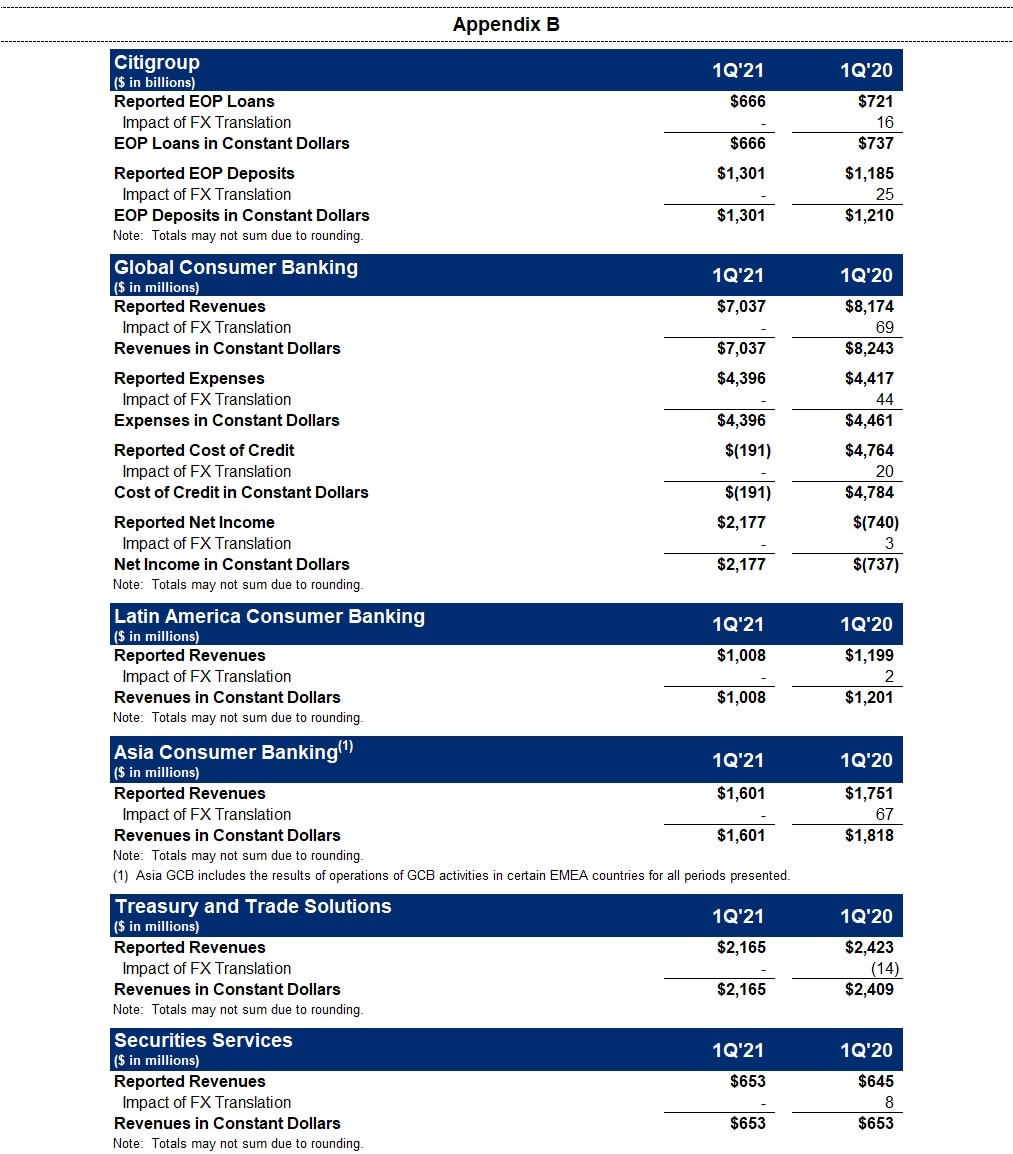
Citigroup's end-of-period loans were $666 billion as of quarter end, down 8% from the prior-year period on a reported basis and 10% excluding the impact of foreign exchange translation5, driven by declines across GCB and ICG.
Citigroup's end-of-period deposits were $1.3 trillion as of quarter end, an increase of 10% on a reported basis and 7% in constant dollars, driven by an 17% increase in GCB and a 5% increase in ICG.
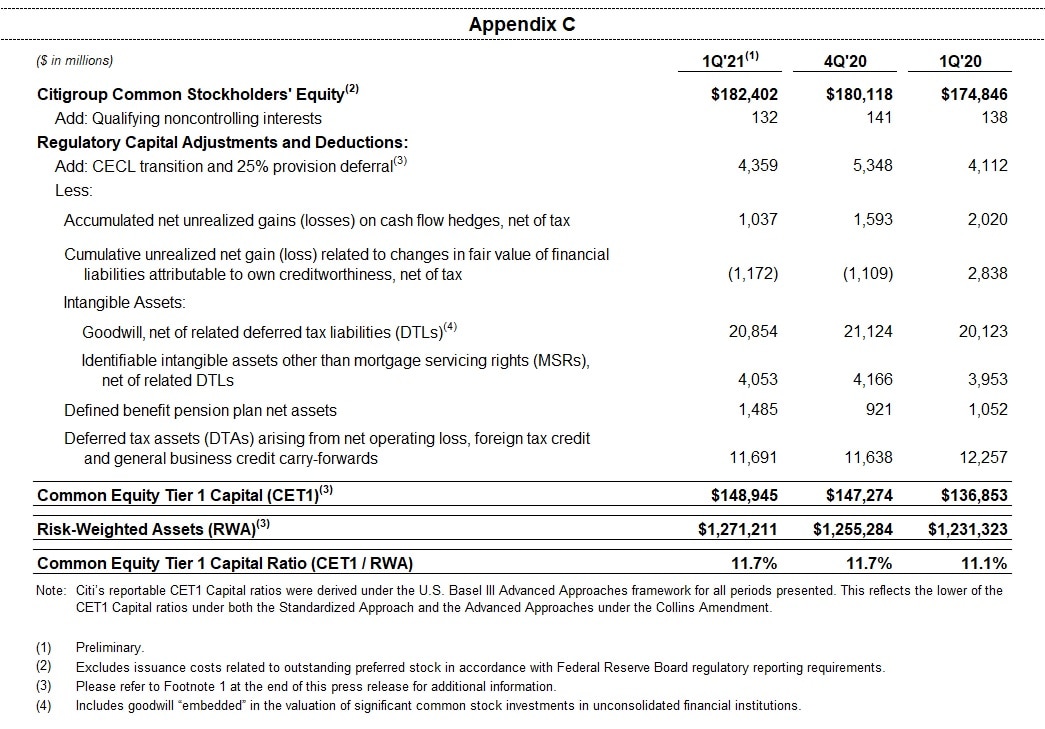
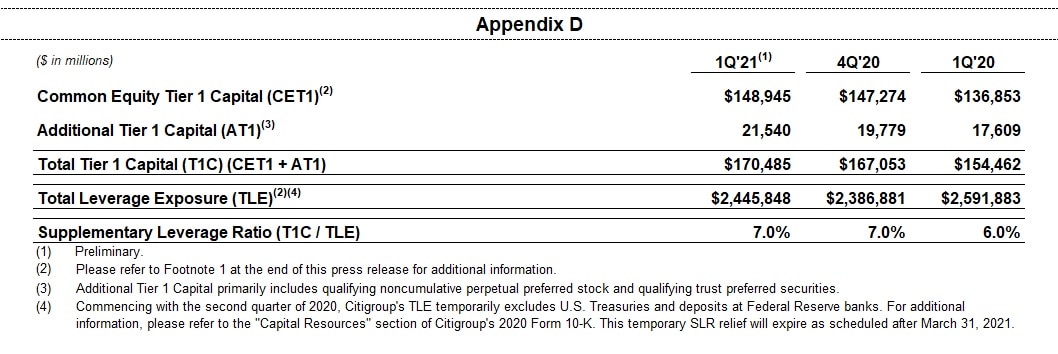
Citigroup's book value per share of $88.18 and tangible book value per share of $75.50 each increased 5%, largely driven by net income. At quarter end, Citigroup's CET1 Capital ratio was 11.7%, unchanged from the prior quarter. Citigroup's SLR for the first quarter 2021 was 7.0%, unchanged from the prior quarter. During the quarter, Citigroup repurchased 23 million common shares and returned a total of $2.7 billion to common shareholders in the form of common share repurchases and dividends.
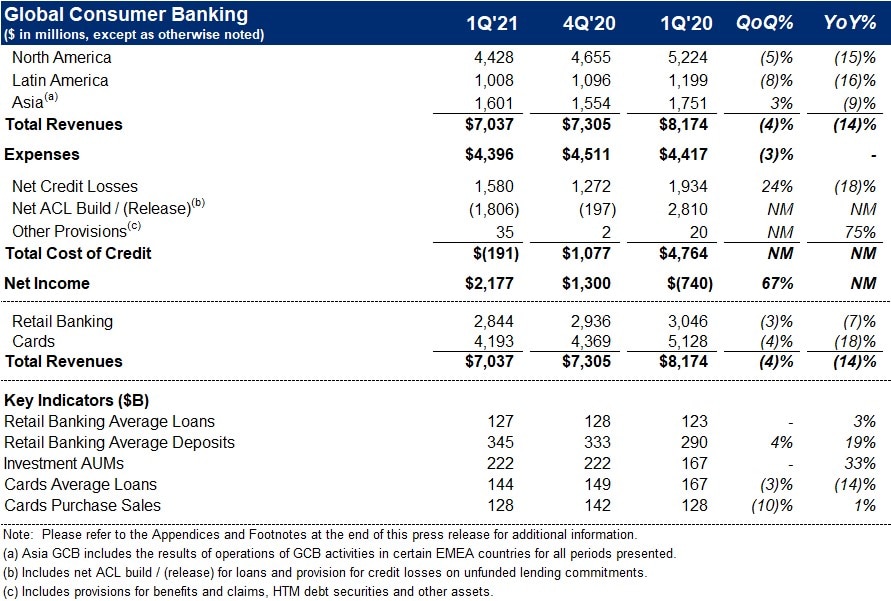
Global Consumer Banking
GCB revenues of $7.0 billion decreased 14% on a reported basis and 15% in constant dollars, as strong deposit growth and momentum in wealth management were more than offset by lower card volumes and lower interest rates across all regions, reflecting the continued impact from the COVID-19 pandemic.
North America GCB revenues of $4.4 billion decreased 15%. Citi-Branded Cards revenues of $2.1 billion decreased 11%, reflecting higher payment rates driving lower average loans. Citi Retail Services revenues of $1.3 billion decreased 26%, reflecting higher partner payments as well as lower average loans. Retail Banking revenues of $1.0 billion decreased 8%, as the benefit of stronger deposit volumes was more than offset by lower deposit spreads.
Latin America GCB revenues of $1.0 billion declined 16% as reported and in constant dollars, driven by lower loan volumes and lower deposit spreads, partially offset by strong deposit growth.
Asia GCB revenues of $1.6 billion declined 9% on a reported basis and 12% in constant dollars, reflecting lower cards revenues, as well as lower deposit spreads, partially offset by strong investments revenues and deposit growth.
GCB operating expenses of $4.4 billion were unchanged on a reported basis and decreased 1% in constant dollars, largely driven by efficiency savings and lower volume-related costs, partially offset by investments.
GCB cost of credit of $(191) million decreased significantly, driven by a net ACL release of $1.8 billion compared to a build in the prior-year period, reflecting lower loan volumes and improvements in the macroeconomic outlook, and lower net credit losses.
GCB net income of $2.2 billion compared to a net loss of $740 million from the prior-year period, primarily driven by the lower cost of credit, partially offset by the decline in revenues.
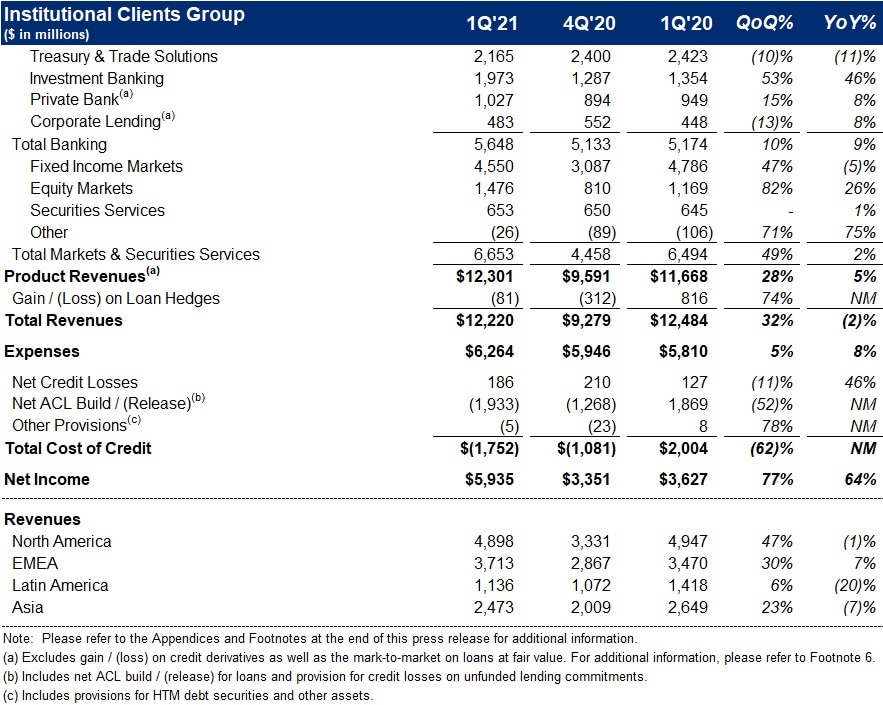
Institutional Clients Group
ICG revenues of $12.2 billion decreased 2%, as revenue growth in Banking and Markets and Securities Services, was more than offset by the absence of mark-to-market gains on loan hedges recorded in the prior-year period6.
Banking revenues of $5.6 billion decreased 7% versus the prior year (including gain / (loss) on loan hedges). Excluding the gain / (loss) on loan hedges Banking revenues increased 9%. Treasury and Trade Solutions revenues of $2.2 billion declined 11% on a reported basis and 10% in constant dollars, as strong client engagement and growth in deposits were more than offset by the impact of lower interest rates and reduced commercial card spend. Investment Banking revenues of $2.0 billion increased 46%, driven by equity underwriting, primarily reflecting higher SPAC activity, as well as growth in debt underwriting, partially offset by lower revenues in Advisory. Advisory revenues decreased 27% to $281 million, while equity underwriting revenues increased significantly to $876 million and debt underwriting revenues increased 4% to $816 million. Private Bank revenues of $1.0 billion increased 8% (excluding gain / (loss) on loan hedges), driven by higher lending volumes and strong managed investments revenues. Corporate Lending revenues of $483 million increased 8% (excluding gain / (loss) on loan hedges), reflecting the absence of prior year marks, partially offset by lower volumes.
Markets and Securities Services revenues of $6.7 billion increased 2%. Fixed Income Markets revenues of $4.6 billion decreased 5% versus a strong prior-year period, as higher revenues across spread products partially offset lower revenues in rates and currencies. Equity Markets revenues of $1.5 billion increased 26%, driven by strong performance in cash equities, derivatives and prime finance, reflecting solid client activity and favorable market conditions. Securities Services revenues of $653 million increased 1% a reported basis, but were unchanged in constant dollars, as growth in deposits, assets under custody and settlement volumes were offset by lower spreads.
ICG operating expenses increased 8% to $6.3 billion, primarily driven by continued investments in infrastructure and controls, along with other strategic investments, higher compensation costs and volume-driven growth.
ICG cost of credit included net credit losses of $186 million, compared to $127 million in the prior-year period, and a net ACL release of $1.9 billion compared to a build of $1.9 billion in the prior-year period. The net ACL release in the current quarter primarily reflected improvements in the outlook for global GDP, as well as modest improvements in portfolio credit quality.
ICG net income of $5.9 billion increased 64%, as the lower cost of credit more than offset the decline in revenues and higher expenses.
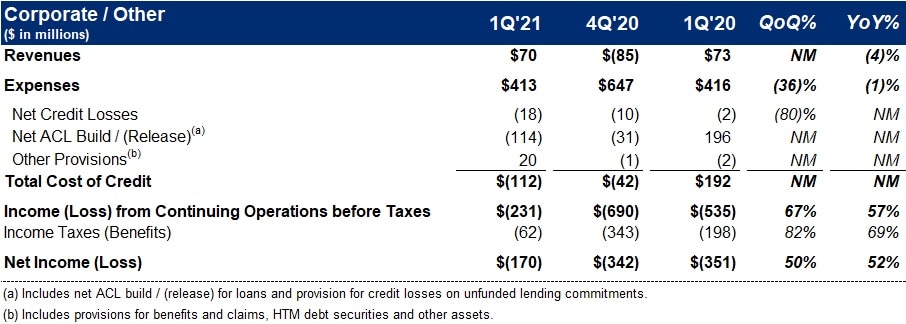
Corporate / Other
Corporate / Other revenues of $70 million declined 4%, but were largely unchanged on a dollar basis versus the prior-year period, as the impact of lower rates was offset by the absence of marks versus the prior year-period and episodic gains this quarter.
Corporate / Other expenses of $413 million were down 1% versus the prior-year period, as investments in infrastructure, risk and controls were roughly offset by the allocation of certain costs to the businesses.
Corporate / Other loss from continuing operations before taxes of $231 million compared to a loss of $535 million in the prior-year period, driven by a net ACL release on the legacy portfolio versus a build in the prior-year period.
Citigroup will host a conference call today at 10 a.m. (ET). A live webcast of the presentation, as well as financial results and presentation materials, will be available at www.citigroup.com/global/investors. Dial-in numbers for the conference call are as follows: (866) 516-9582 in the U.S. and Canada; (973) 409-9210 outside of the U.S. and Canada. The conference code for both numbers is 2856516.
Additional financial, statistical and business-related information, as well as business and segment trends, is included in a Quarterly Financial Data Supplement. Both this earnings release and Citigroup's First Quarter 2021 Quarterly Financial Data Supplement are available on Citigroup's website at www.citigroup.com.
Citi
Contacts: