Second Quarter 2021 Results and Key Metrics
HIGHLIGHTS
- Net Income of $6.2 Billion ($2.85 per Share)
- Revenues of $17.5 Billion
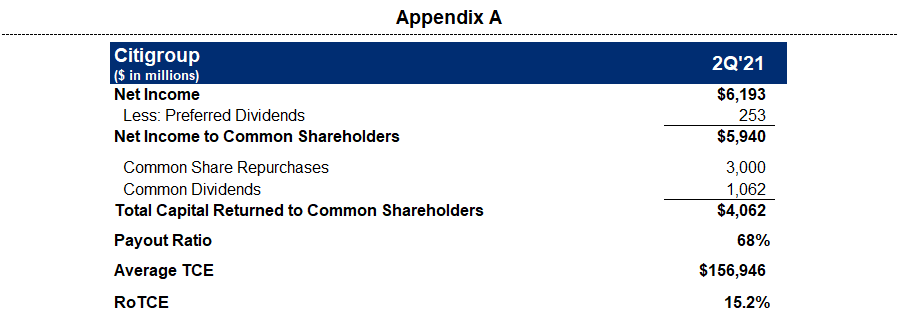
- Returned $4.1 Billion of Capital to Common Shareholders
- Repurchased 40 Million Common Shares
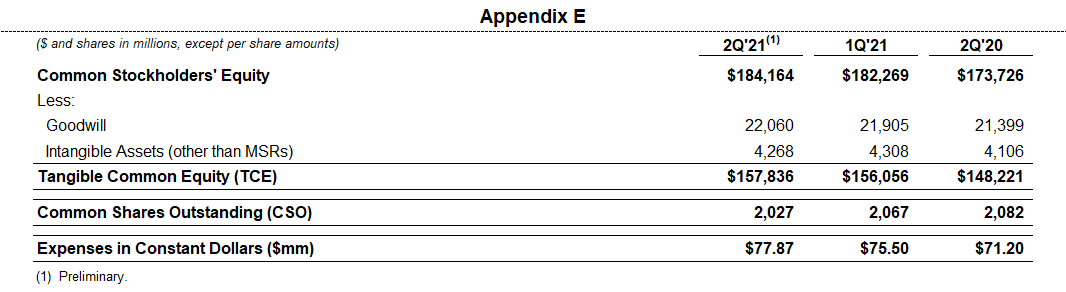
- Book Value per Share of $90.86
- Tangible Book Value per Share of $77.874
Read the full press release with tables and CEO commentary.
View the Financial Supplement (PDF)
View Financial Supplement (Excel)
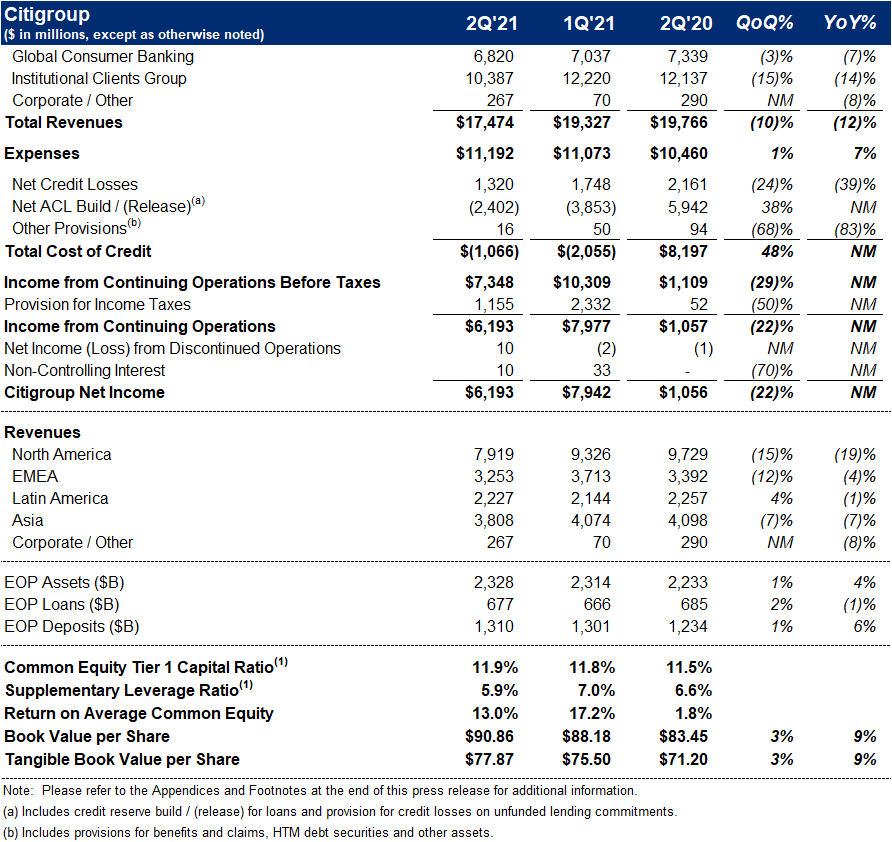
New York – Citigroup Inc. today reported net income for the second quarter 2021 of $6.2 billion, or $2.85 per diluted share, on revenues of $17.5 billion. This compared to net income of $1.1 billion, or $0.38 per diluted share, on revenues of $19.8 billion for the second quarter 2020.
Revenues decreased 12% from the prior-year period, primarily reflecting normalization in market activity in Fixed Income Markets within the Institutional Clients Group (ICG), along with lower average card loans in Global Consumer Banking (GCB), as well as the impact of lower interest rates. Net income of $6.2 billion increased significantly from the prior-year period driven by the lower cost of credit. Earnings per share of $2.85 also increased significantly from the prior-year period, reflecting the growth in net income, as well as a slight decline in shares outstanding.
Jane Fraser, Citi CEO, said, "The pace of the global recovery is exceeding earlier expectations and with it, consumer and corporate confidence is rising. We saw this across our businesses, as reflected in our performance in Investment Banking and Equities as well as markedly increased spending on our credit cards. While we have to be mindful of the unevenness in the recovery globally, we are optimistic about the momentum ahead.
"During the first half of the year, we returned nearly $7 billion in capital to our shareholders, the most that was permitted by the Federal Reserve. We ended the quarter with a Common Equity Tier One ratio of 11.9% and we intend to continue to return our excess capital, over and above the amount we need to make strategic investments. We are making progress on our strategy refresh across our consumer and institutional businesses. Our overarching goal is to increase the returns we generate and close the gap with our peers. We have set out to modernize our bank and want to achieve nothing less than excellence in our risk and control environment, our operations and our service to clients," Fraser concluded.
Percentage comparisons throughout this press release are calculated for the second quarter 2021 versus the second quarter 2020, unless otherwise specified.
Second Quarter Financial Results
Citigroup
Citigroup revenues of $17.5 billion in the second quarter 2021 decreased 12%, primarily driven by market normalization in Fixed Income Markets within ICG, and lower average card loans in GCB.
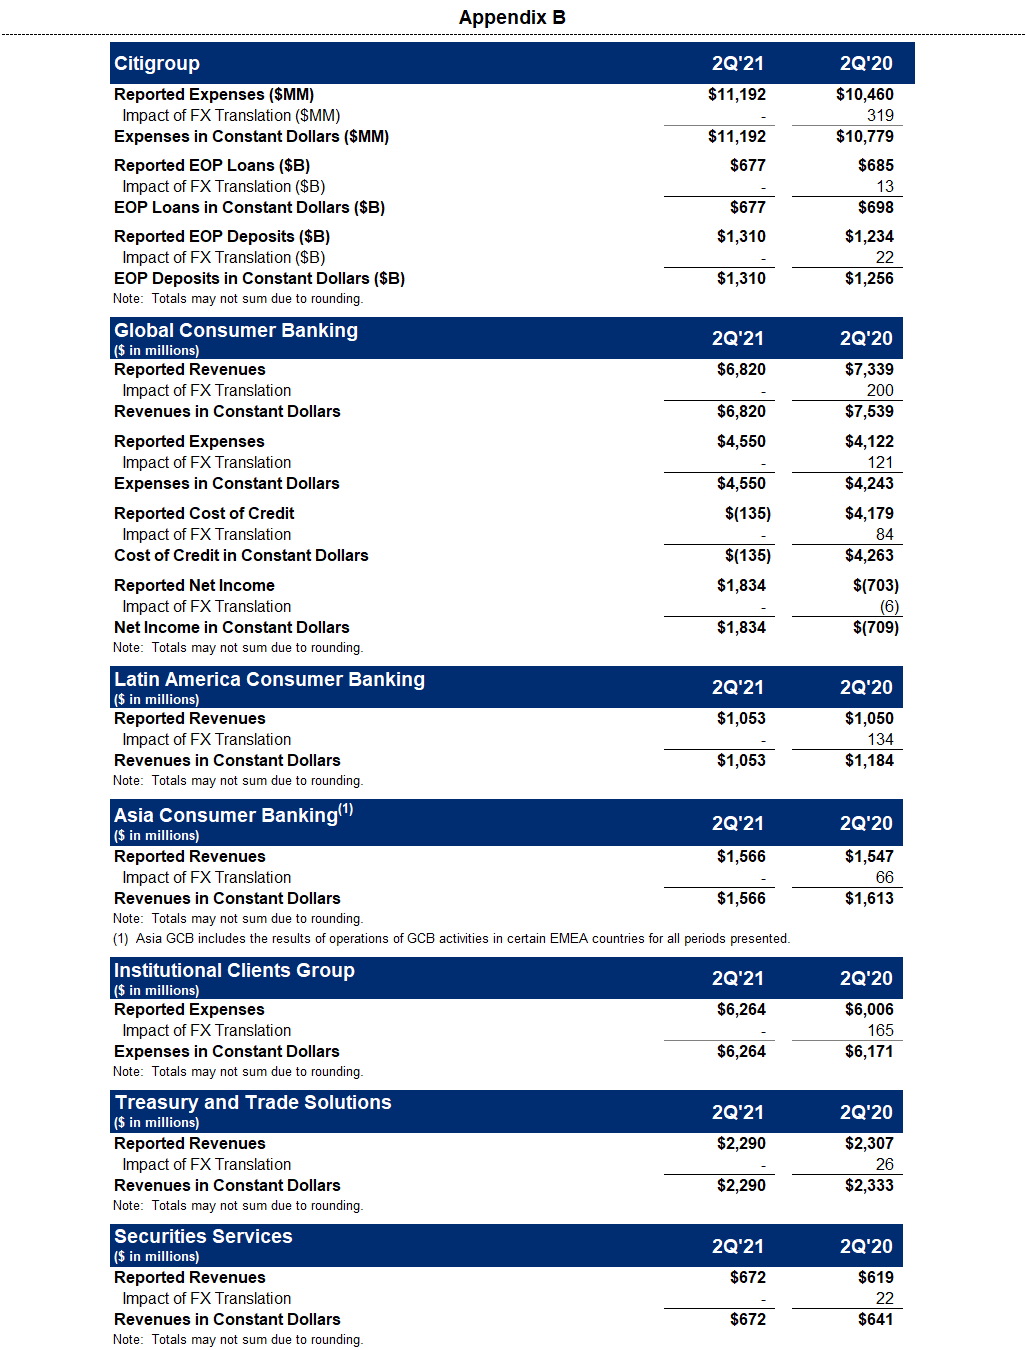
Citigroup operating expenses of $11.2 billion in the second quarter 2021 increased 7% on a reported basis. Excluding the impact of foreign exchange translation5, expenses increased 4%, reflecting a normalization relative to a low comparison in the prior-year period, along with continued investments in Citi's transformation, as well as other strategic investments, partially offset by productivity savings.
Citigroup cost of credit of $(1.1) billion in the second quarter 2021 compared to $8.2 billion in the prior-year period, reflecting an improvement in net credit losses and a release of allowance for credit loss (ACL) reserves, driven by improvements in portfolio quality, as well as the continued improvement in the macroeconomic outlook.
Citigroup net income of $6.2 billion in the second quarter 2021 compared to $1.1 billion in the prior-year period, driven by lower cost of credit. Citigroup's effective tax rate was 16% in the current quarter compared to 5% in the second quarter 2020. The current quarter tax rate reflects certain tax benefit items related to non-U.S. operations. The prior-year period reflected a higher relative impact of tax advantaged investments and other tax benefit items on a lower level of pre-tax income.
Citigroup's allowance for credit losses on loans was $19.2 billion at quarter end, or 2.88% of total loans, compared to $26.3 billion, or 3.87% of total loans, at the end of the prior-year period. Total non-accrual assets decreased 25% from the prior-year period to $4.4 billion. Consumer non-accrual loans decreased 1% to $1.8 billion, while corporate non-accrual loans of $2.6 billion decreased 36% from the prior-year period.
Citigroup's end-of-period loans were $677 billion as of quarter end, down 1% from the prior-year period on a reported basis and 3% in constant dollars, driven by declines across GCB and ICG, reflecting higher repayment rates.
Citigroup's end-of-period deposits were $1.3 trillion as of quarter end, an increase of 6% on a reported basis and 4% in constant dollars, driven by an 11% increase in GCB and a 3% increase in ICG.
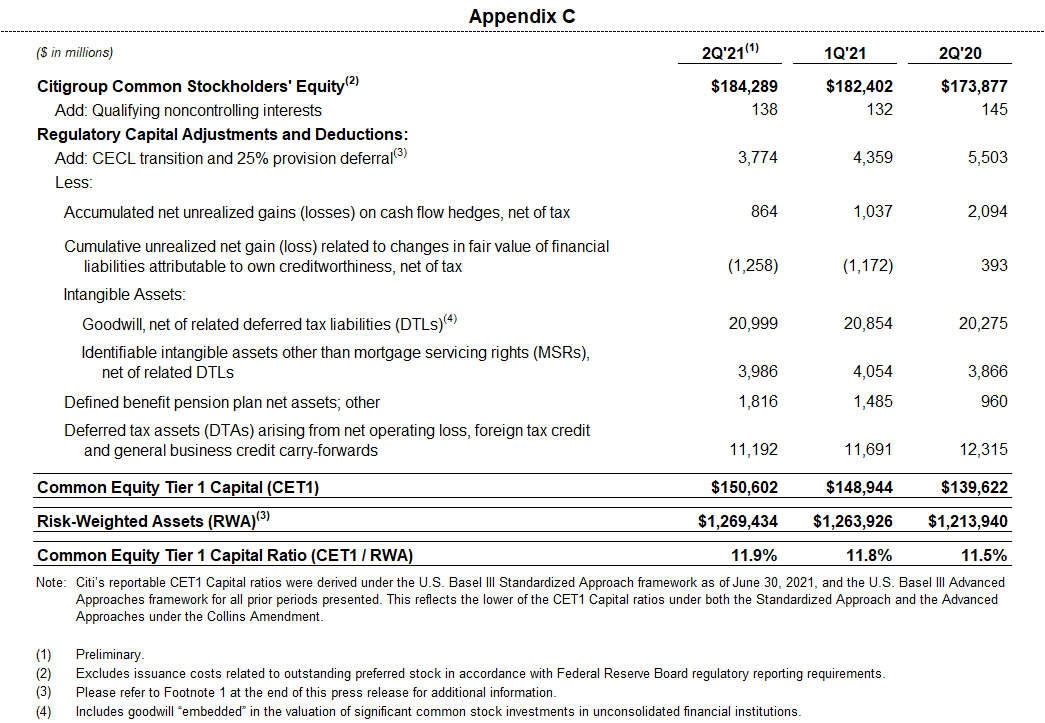
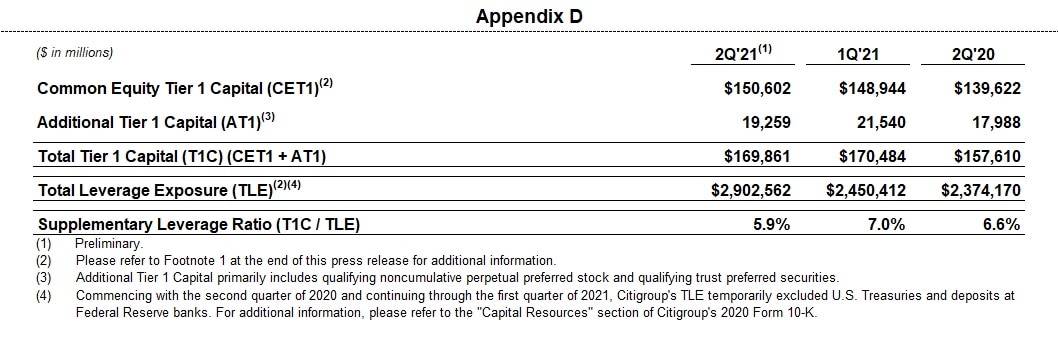
Citigroup's book value per share of $90.86 and tangible book value per share of $77.87 each increased 9%, largely driven by net income. At quarter end, Citigroup's CET1 Capital ratio was 11.9%, an increase from the prior quarter. Citigroup's SLR for the second quarter 2021 was 5.9%, a decrease from the prior quarter, largely driven by the expiration of the temporary SLR relief. During the quarter, Citigroup repurchased 40 million common shares and returned a total of $4.1 billion to common shareholders in the form of common share repurchases and dividends.
Global Consumer Banking
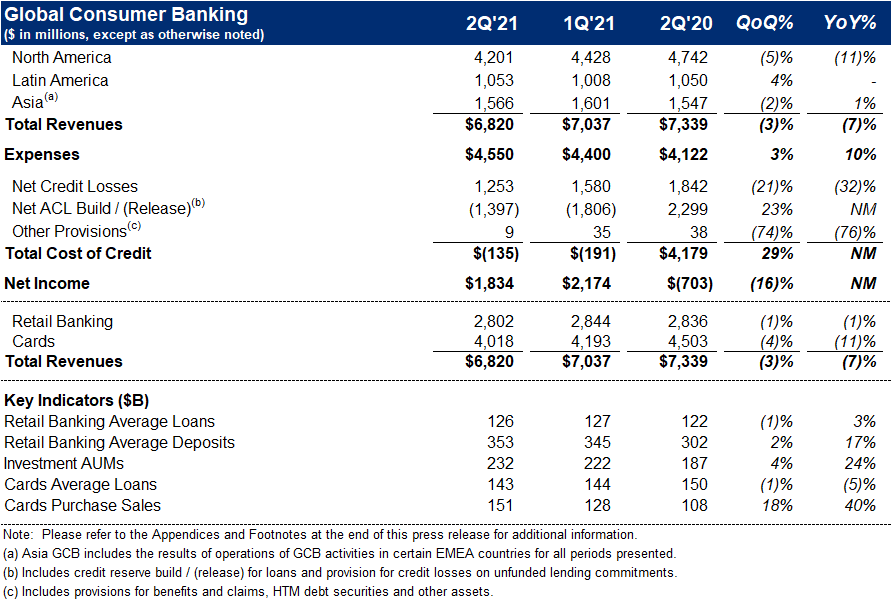
GCB revenues of $6.8 billion decreased 7% on a reported basis and 10% in constant dollars, as continued strong deposit growth and momentum in investment management were more than offset by lower average card loans and deposits spreads across all three regions.
North America GCB revenues of $4.2 billion decreased 11%. Citi-Branded Cards revenues of $2.0 billion decreased 12%, reflecting lower average loans. Citi Retail Services revenues of $1.2 billion decreased 14%, primarily driven by lower average loans. Retail Banking revenues of $1.0 billion decreased 7%, as the benefit of stronger deposit volumes was more than offset by lower deposit spreads, as well as lower mortgage revenues.
Latin America GCB revenues of $1.1 billion were unchanged on a reported basis and decreased 11% in constant dollars, driven by lower loan volumes and lower deposit spreads, partially offset by growth in assets under management.
Asia GCB revenues of $1.6 billion increased 1% on a reported basis and declined 3% in constant dollars, as strong investment revenues were more than offset by lower deposit spreads.
GCB operating expenses of $4.6 billion increased 10% on a reported basis and 7% in constant dollars, reflecting continued investments in Citi's transformation, as well as other strategic investments, an acceleration in acquisition marketing and higher volume-related costs, partially offset by efficiency savings.
GCB cost of credit of $(135) million decreased significantly, driven by a net ACL release of $1.4 billion compared to a build in the prior-year period, reflecting improvements in both portfolio credit quality and the macroeconomic outlook, as well as lower net credit losses.
GCB net income of $1.8 billion increased significantly, as the lower cost of credit more than offset the decline in revenues and higher expenses.
Institutional Clients Group
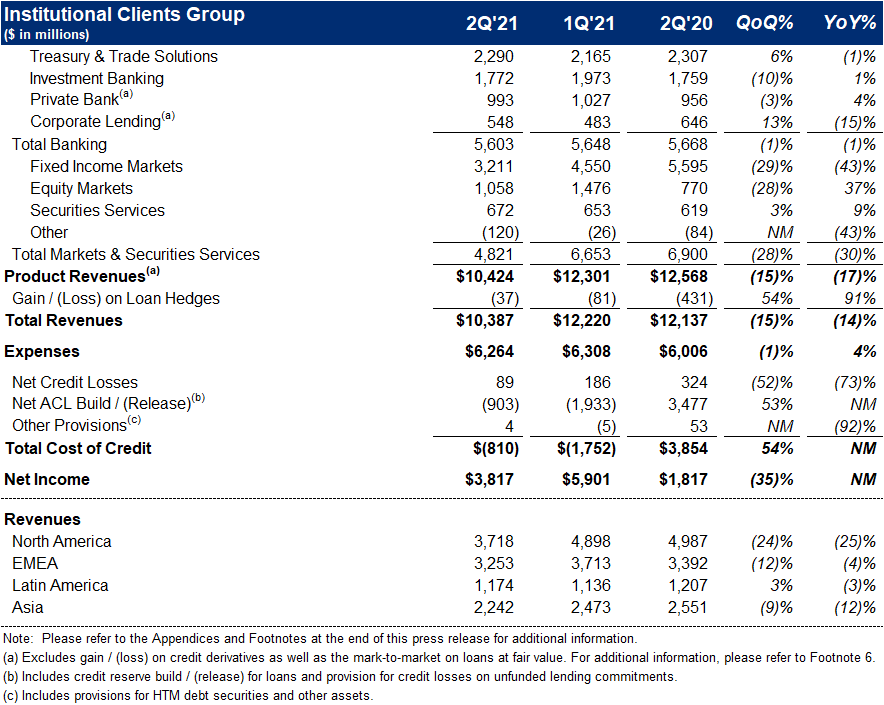
ICG revenues of $10.4 billion decreased 14%, primarily driven by declines in Fixed Income Markets and Corporate Lending, partially offset by higher revenues in Equity Markets, the Private Bank and Securities Services.
Banking revenues of $5.6 billion increased 6% versus the prior year (including gain / (loss) on loan hedges)6. Excluding the gain / (loss) on loan hedges, Banking revenues decreased 1%. Treasury and Trade Solutions revenues of $2.3 billion declined 1% on a reported basis and 2% in constant dollars, as higher fee revenues, reflecting strong client engagement, and growth in trade were more than offset by the impact of lower interest rates. Investment Banking revenues of $1.8 billion increased 1%, reflecting revenue growth in advisory and equity underwriting, largely offset by lower revenues in debt underwriting. Debt underwriting revenues decreased 21% to $823 million, while equity underwriting revenues increased 11% to $544 million and Advisory revenues increased 77% to $405 million. Private Bank revenues of $993 million increased 4% (excluding gain / (loss) on loan hedges), driven by higher fees and lending volumes, partially offset by the impact of lower interest rates. Corporate Lending revenues of $548 million decreased 15% (excluding gain / (loss) on loan hedges), primarily driven by lower volumes.
Markets and Securities Services revenues of $4.8 billion decreased 30%. Fixed Income Markets revenues of $3.2 billion decreased 43% versus a strong prior-year period in both rates and spread products. Equity Markets revenues of $1.1 billion increased 37%, driven by strong performance in derivatives and prime finance, reflecting solid client activity and favorable market conditions. Securities Services revenues of $672 million increased 9% on a reported basis and 5% in constant dollars, primarily reflecting growth in fee revenues, driven by growth in assets under custody and settlement volumes, partially offset by lower spreads.
ICG operating expenses of $6.3 billion increased 4% on a reported basis and 2% in constant dollars, primarily driven by continued investments in Citi's transformation, along with other strategic investments, partially offset by lower incentive compensation and efficiency savings.
ICG cost of credit included net credit losses of $89 million, compared to $324 million in the prior-year period, and a net ACL release of $903 million compared to a build of $3.5 billion in the prior-year period. The net ACL release in the current quarter primarily reflected improvements in portfolio credit quality, as well as the continued improvement in the macroeconomic outlook.
ICG net income of $3.8 billion increased significantly, as the lower cost of credit more than offset the decline in revenues and higher expenses.
Corporate / Other
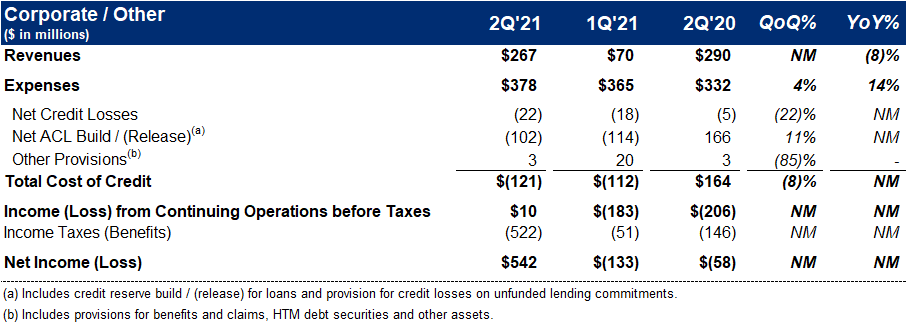
Corporate / Other revenues of $267 million declined 8%, but were largely unchanged on a dollar basis versus the prior-year period, as episodic gains in the quarter, were more than offset by previously disclosed one-time items in the prior year-period.
Corporate / Other expenses of $378 million were up 14%, but were largely unchanged on a dollar basis versus the prior-year period, primarily driven by the impact of foreign exchange translation.
Corporate / Other loss from continuing operations before taxes oof $10 million compared to a loss of $206 million in the prior-year period, largely driven by a net ACL release on the legacy portfolio versus a build in the prior-year period.
Citigroup will host a conference call today at 10 a.m. (ET). A live webcast of the presentation, as well as financial results and presentation materials, will be available at https://www.citigroup.com/global/investors. Dial-in numbers for the conference call are as follows: (866) 516-9582 in the U.S. and Canada; (973) 409-9210 outside of the U.S. and Canada. The conference code for both numbers is 7596727.
Additional financial, statistical and business-related information, as well as business and segment trends, is included in a Quarterly Financial Data Supplement. Both this earnings release and Citigroup's Second Quarter 2021 Quarterly Financial Data Supplement are available on Citigroup's website at www.citigroup.com.
Press: Danielle Romero-Apsilos (212) 816-2264