Third Quarter 2021 Results and Key Metrics
HIGHLIGHTS
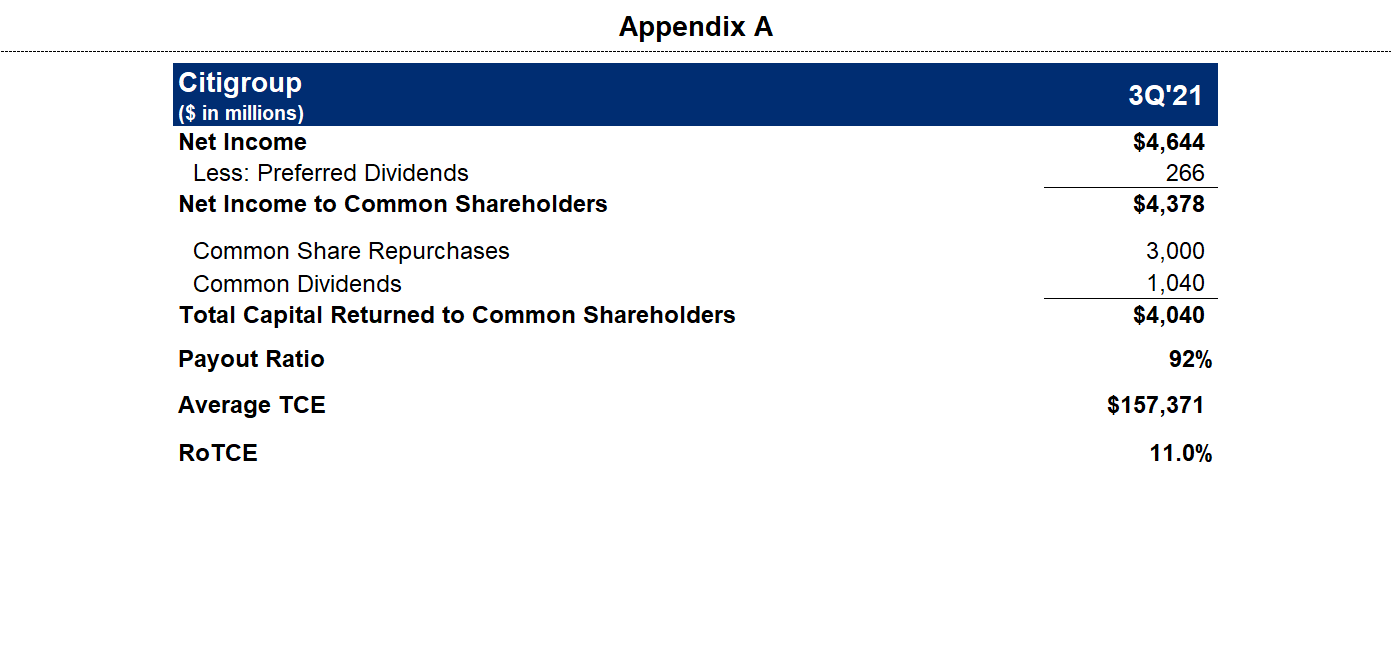
- Repurchased 43 Million Common Shares
- Returned $4.0 Billion of Capital to Common Shareholders
- Payout Ratio of 92%3
- Book Value per Share of $92.16
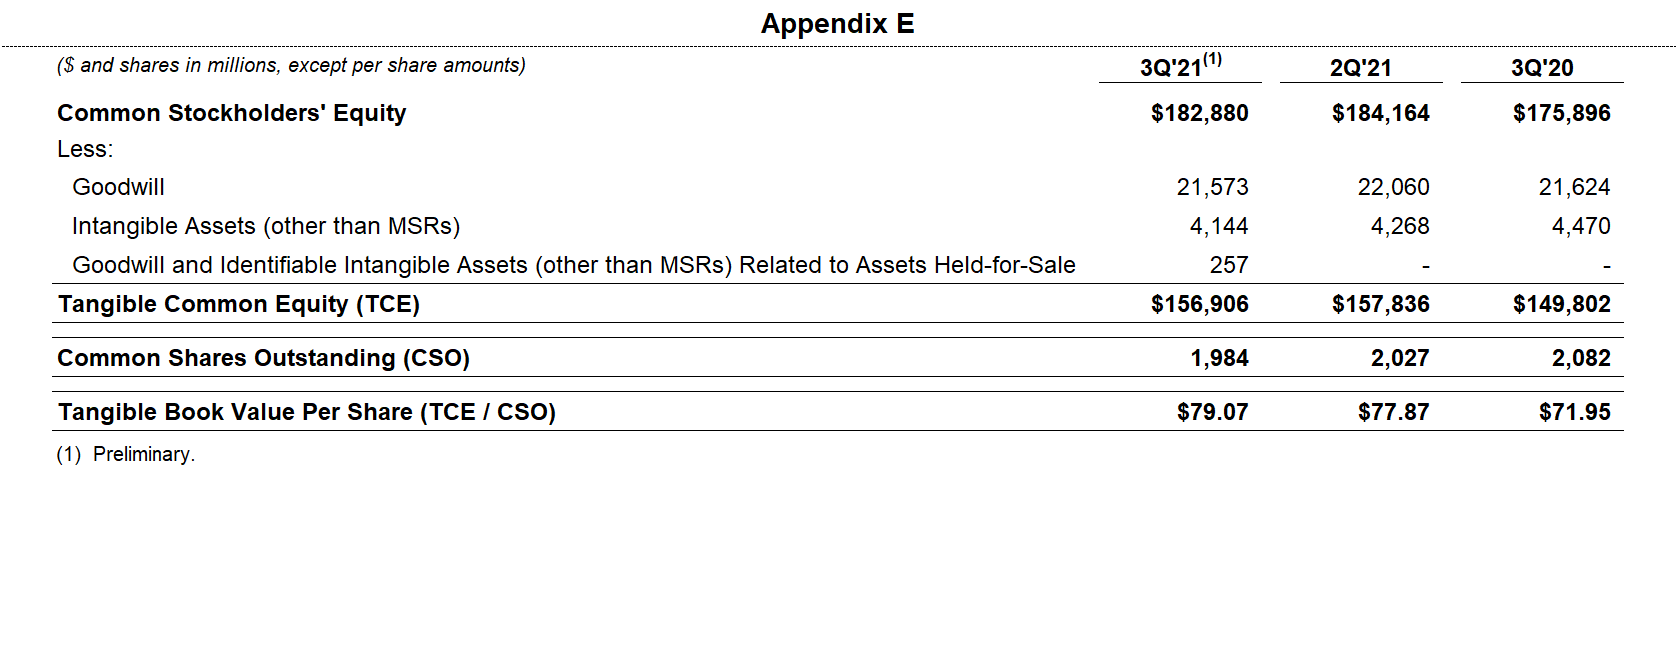
- Tangible Book Value per Share of $79.074
Read the full press release with tables and CEO commentary.
View the Financial Supplement (PDF)
View Financial Supplement (Excel)
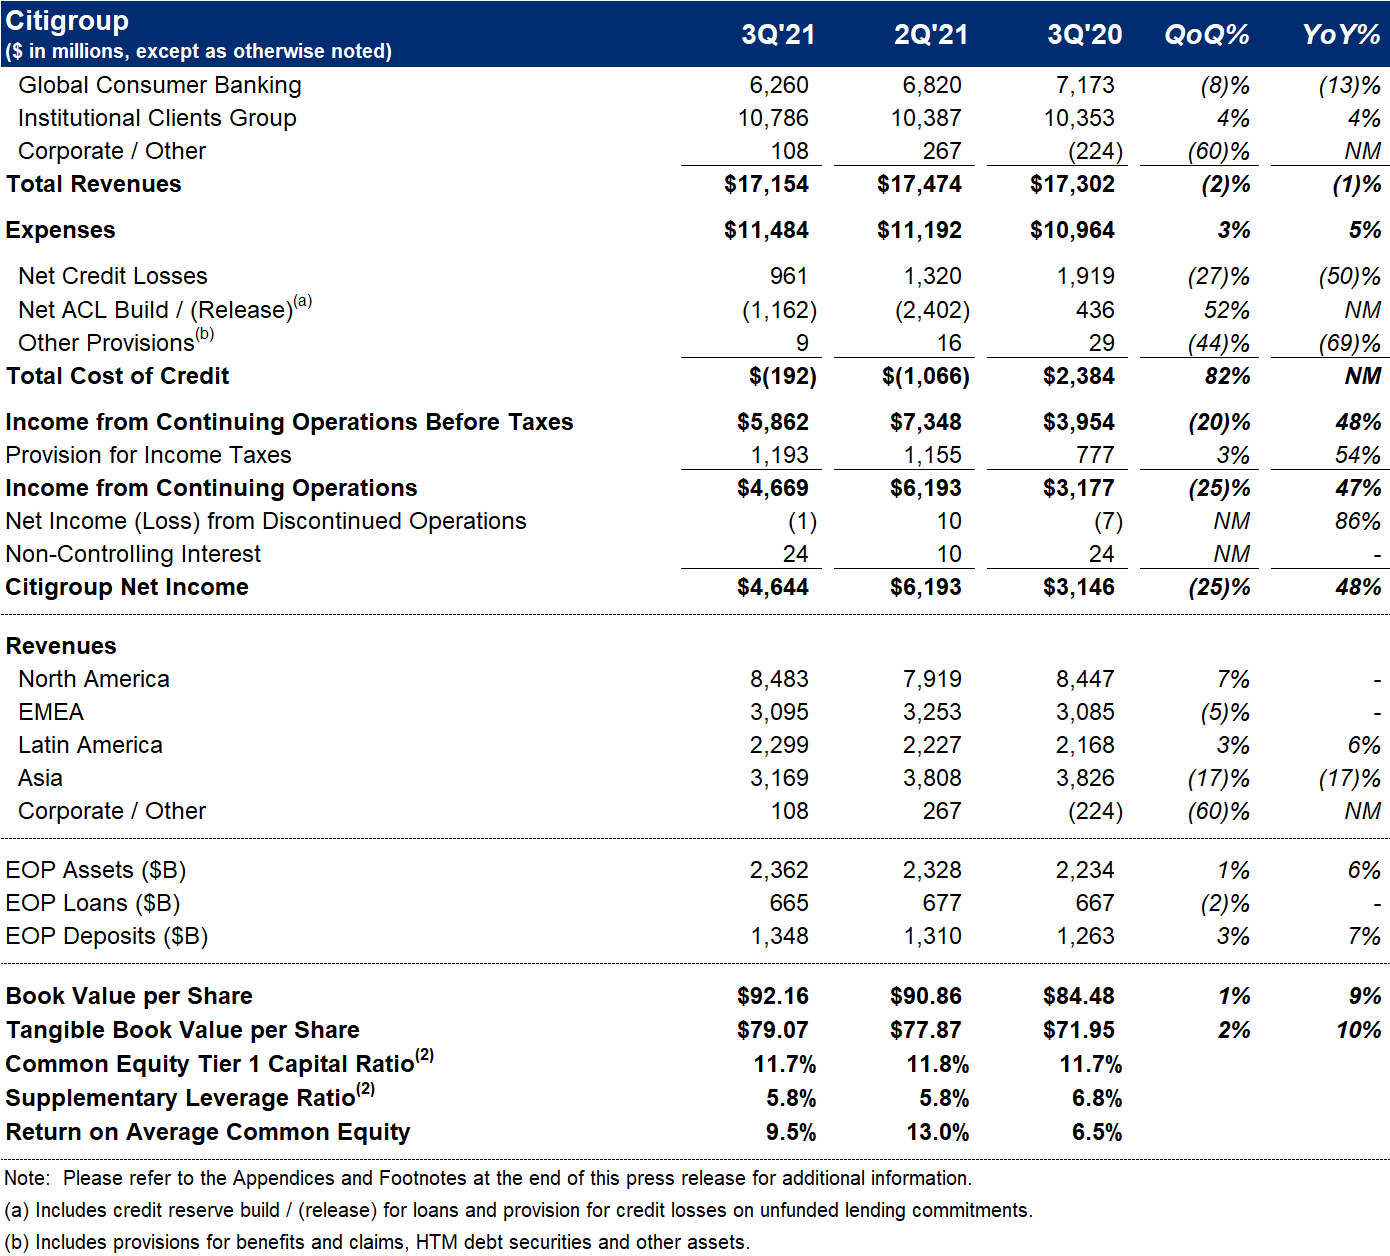
New York – Citigroup Inc. today reported net income for the third quarter 2021 of $4.6 billion, or $2.15 per diluted share, on revenues of $17.2 billion. This compared to net income of $3.1 billion, or $1.36 per diluted share, on revenues of $17.3 billion for the third quarter 2020.
Revenues declined 1% from the prior-year period, including a pre-tax loss of approximately $680 million related to the sale of the Australia consumer business in Global Consumer Banking (GCB). Excluding the loss on sale5, revenues increased 3%, largely driven by growth across the Institutional Clients Group (ICG).
Net income of $4.6 billion increased 48% from the prior-year period driven by a lower cost of credit, partially offset by the lower revenues and higher expenses.
Earnings per share of $2.15 increased 58% from the prior-year period, reflecting the growth in net income, as well as a 3% decline in shares outstanding.
Jane Fraser, Citi CEO, said, "The recovery from the pandemic continues to drive corporate and consumer confidence and is creating very active client engagement as you can see through our strong results in Investment Banking and Equity Markets, both up approximately 40% year-over-year, in addition to double- digit fee growth in Treasury and Trade Solutions as we help our clients reposition their supply chains. And while strong consumer balance sheets have impacted lending, we are seeing higher consumer spending across our cards products. We also continue to show momentum in deposits and wealth management AUM as well as growing engagement across our digital channels. Overall, our revenues were 3% higher than last year excluding the impact of the sale of our consumer business in Australia.
"We are moving forward with urgency on our top priorities in order to responsibly narrow the returns gap with our peers: the Transformation, refreshing our strategy and building a culture of excellence. So far this year, we have returned close to $11 billion to shareholders through a healthy dividend and stock repurchases. We remain committed to returning excess capital over and above the amount necessary to invest in our franchise and to maintain our safety and soundness.
"Overall, I am quite pleased with $4.6 billion in net income given the environment we are operating in. While we have much work ahead, we are getting results from the investments we have been making and seeing both the strength and durability of our franchise," Ms. Fraser concluded.
Percentage comparisons throughout this press release are calculated for the third quarter 2021 versus the third quarter 2020, unless otherwise specified.
Third Quarter Financial Results
Citigroup
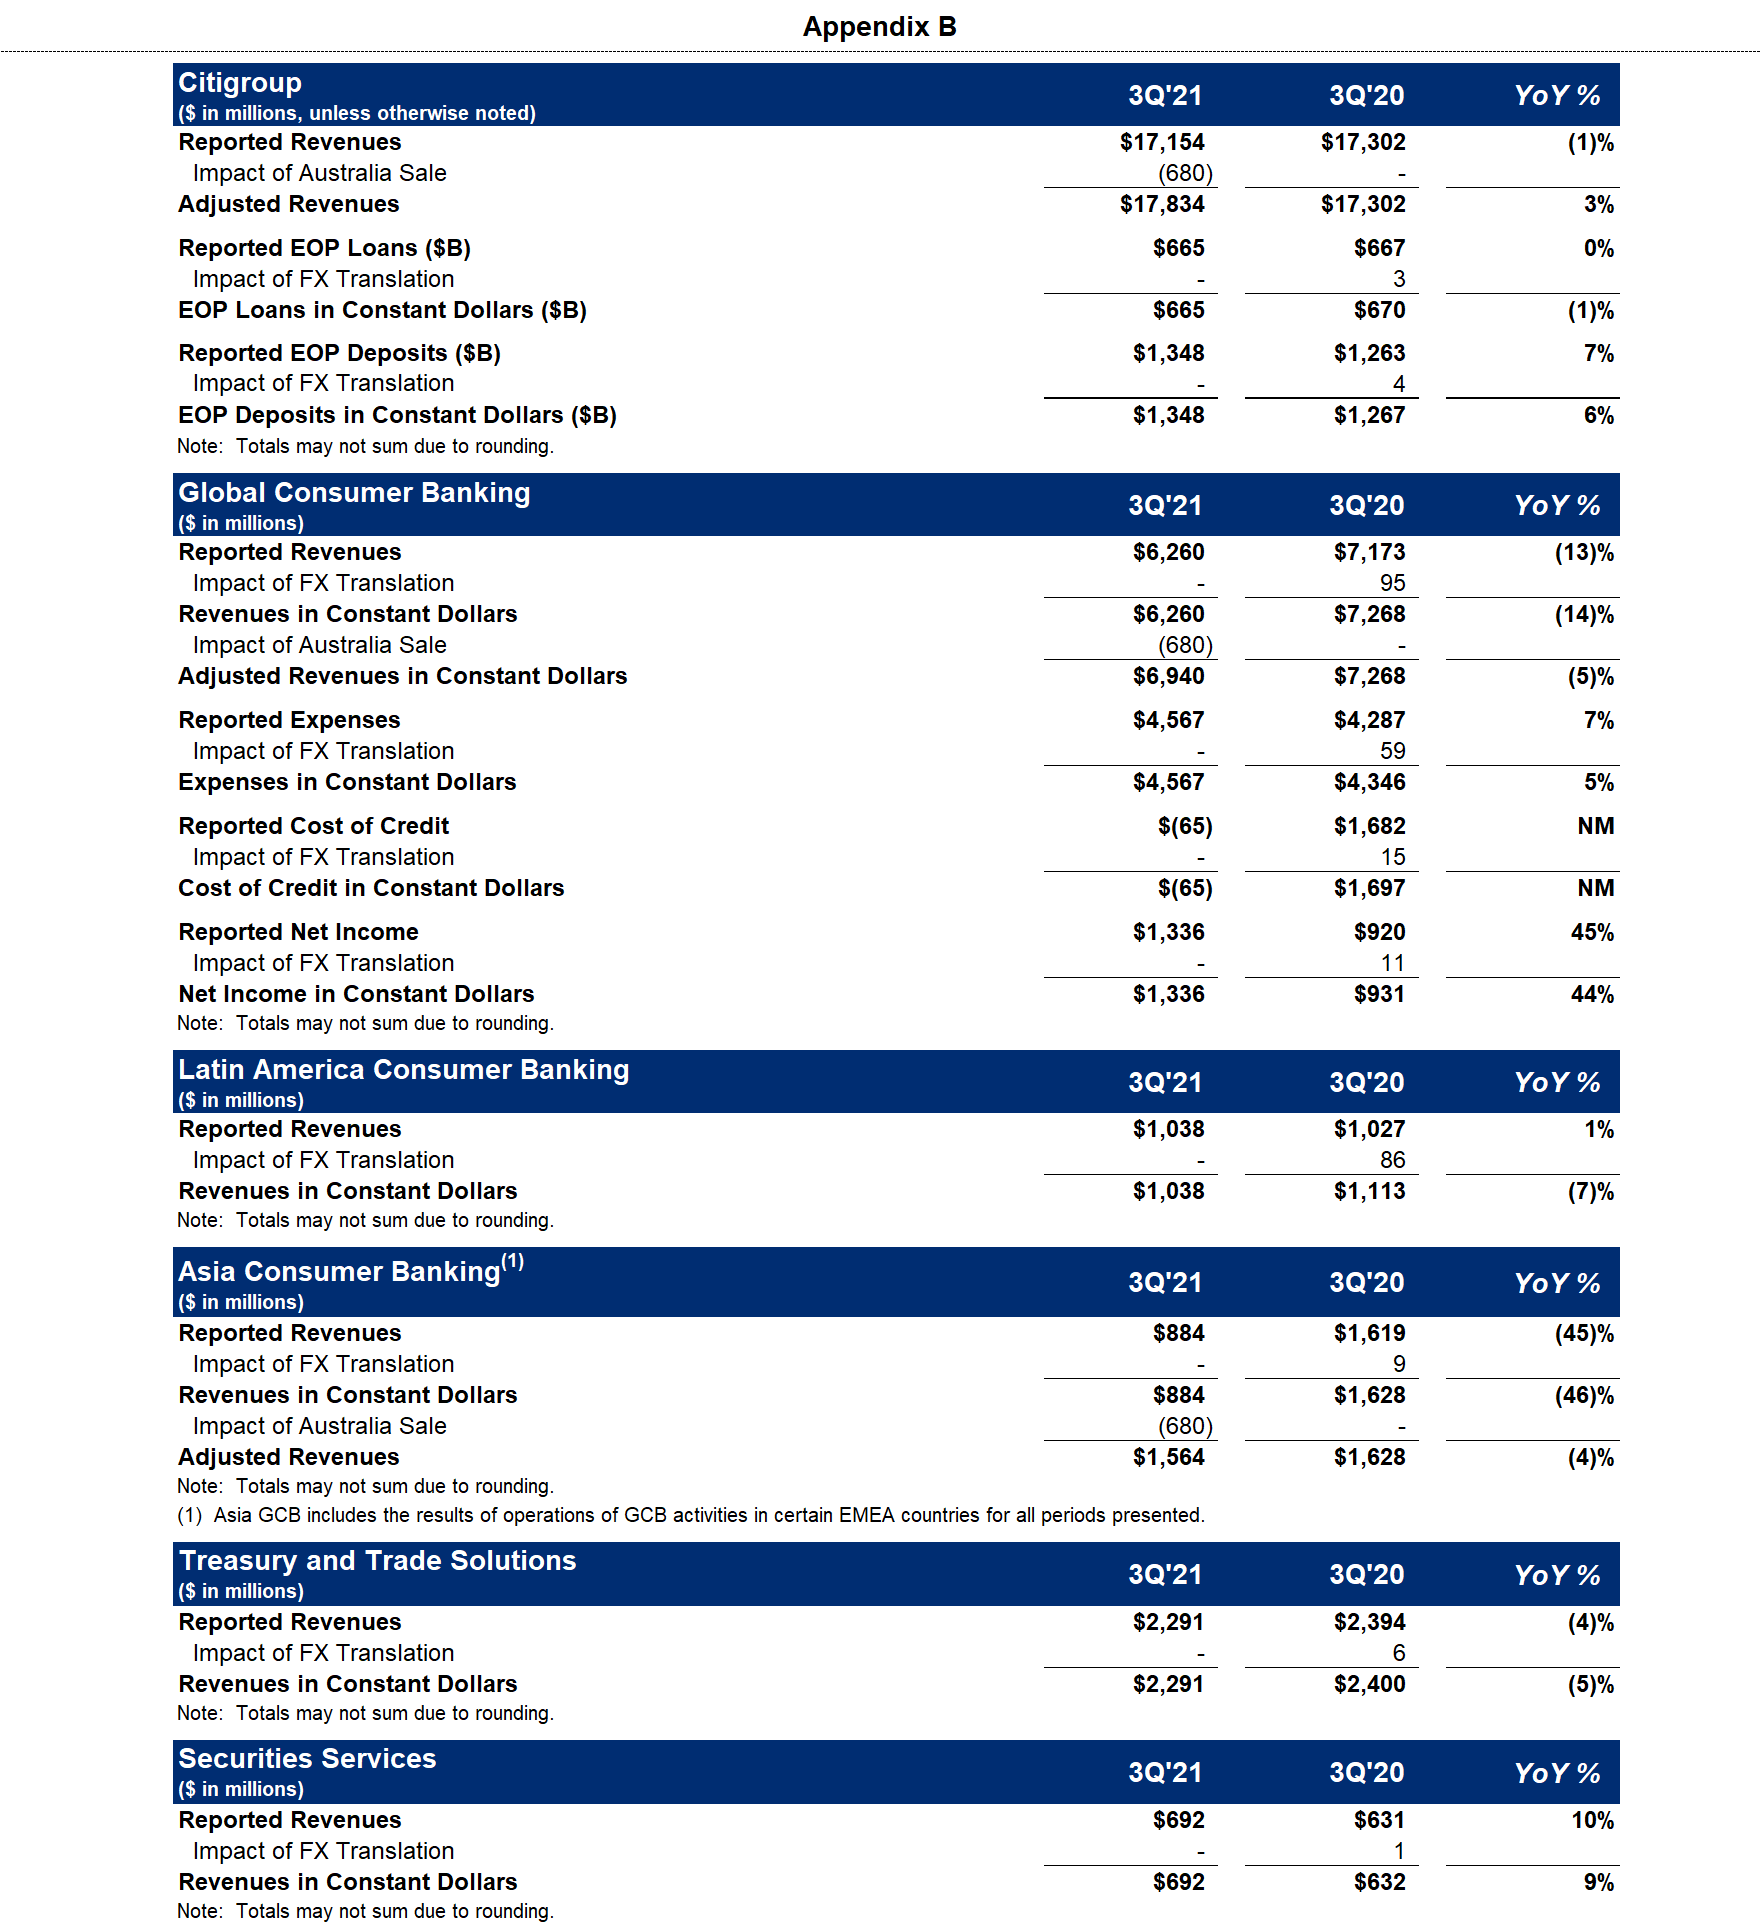
Citigroup revenues of $17.2 billion in the third quarter 2021 decreased 1%. Excluding the Australia loss on sale, revenues increased 3%, reflecting strong growth in Investment Banking, Equity Markets and Securities Services in ICG, along with growth in Corporate / Other, partially offset by lower revenues in North America GCB and Asia GCB.
Citigroup operating expenses of $11.5 billion in the third quarter 2021 increased 5%, reflecting continued investments in Citi's transformation, business-led investments and revenue-related expenses, partially offset by efficiency savings.
Citigroup cost of credit of $(0.2) billion in the third quarter 2021 compared to $2.4 billion in the prior-year period, reflecting a release of allowance for credit loss (ACL) reserves and an improvement in net credit losses, driven by continued improvement in portfolio credit quality.
Citigroup net income of $4.6 billion in the third quarter 2021 increased 48% from the prior-year period, driven by the lower cost of credit, partially offset by the higher expenses and lower revenues. Citigroup's effective tax rate was 20% in the current quarter, largely unchanged from the third quarter 2020.
Citigroup's allowance for credit losses on loans was $17.7 billion at quarter end, or 2.69% of total loans, compared to $26.4 billion, or 4.00% of total loans, at the end of the prior-year period. Total non-accrual assets decreased 25% from the prior-year period to $4.0 billion. Consumer non-accrual loans decreased 6% to $1.6 billion, while corporate non-accrual loans of $2.4 billion decreased 33% from the prior-year period.
Citigroup's end-of-period loans were $665 billion as of quarter end, largely unchanged from the prior-year period on a reported basis. Excluding the impact of foreign exchange translation6, loans decreased 1%, primarily reflecting the impact of the sale of the consumer business in Australia.
Citigroup's end-of-period deposits were $1.3 trillion as of quarter end, an increase of 7% on a reported basis and 6% in constant dollars, driven by an 8% increase in GCB and a 6% increase in ICG.
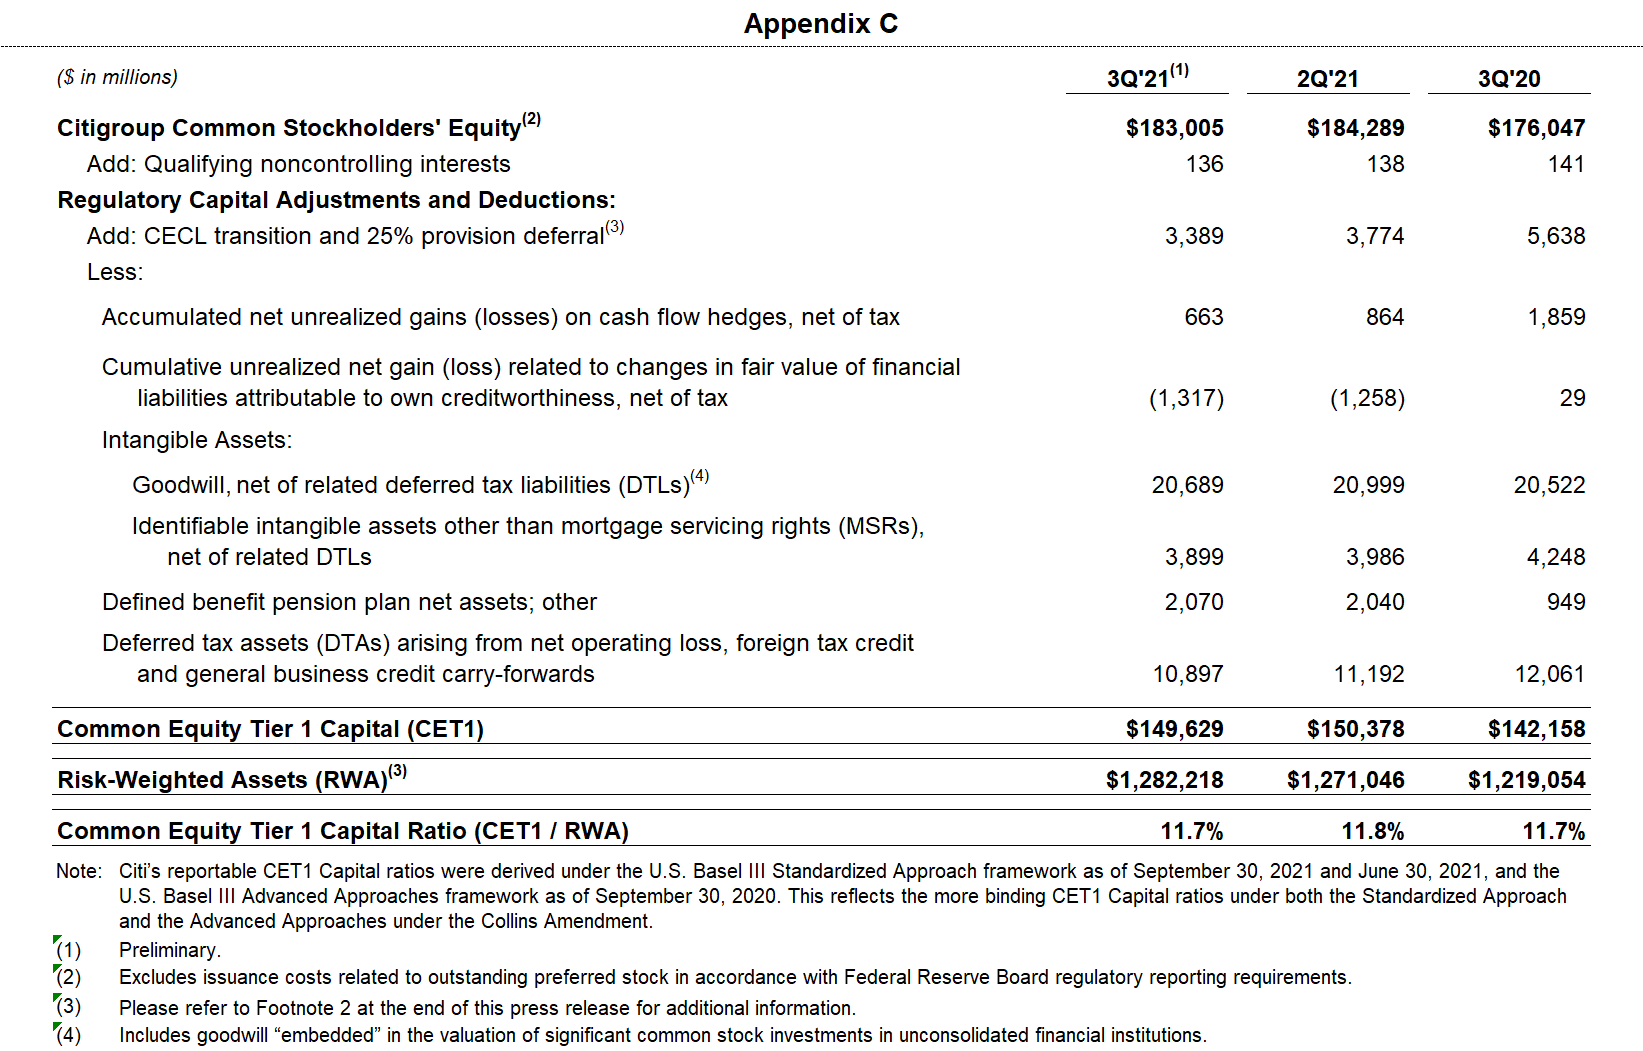
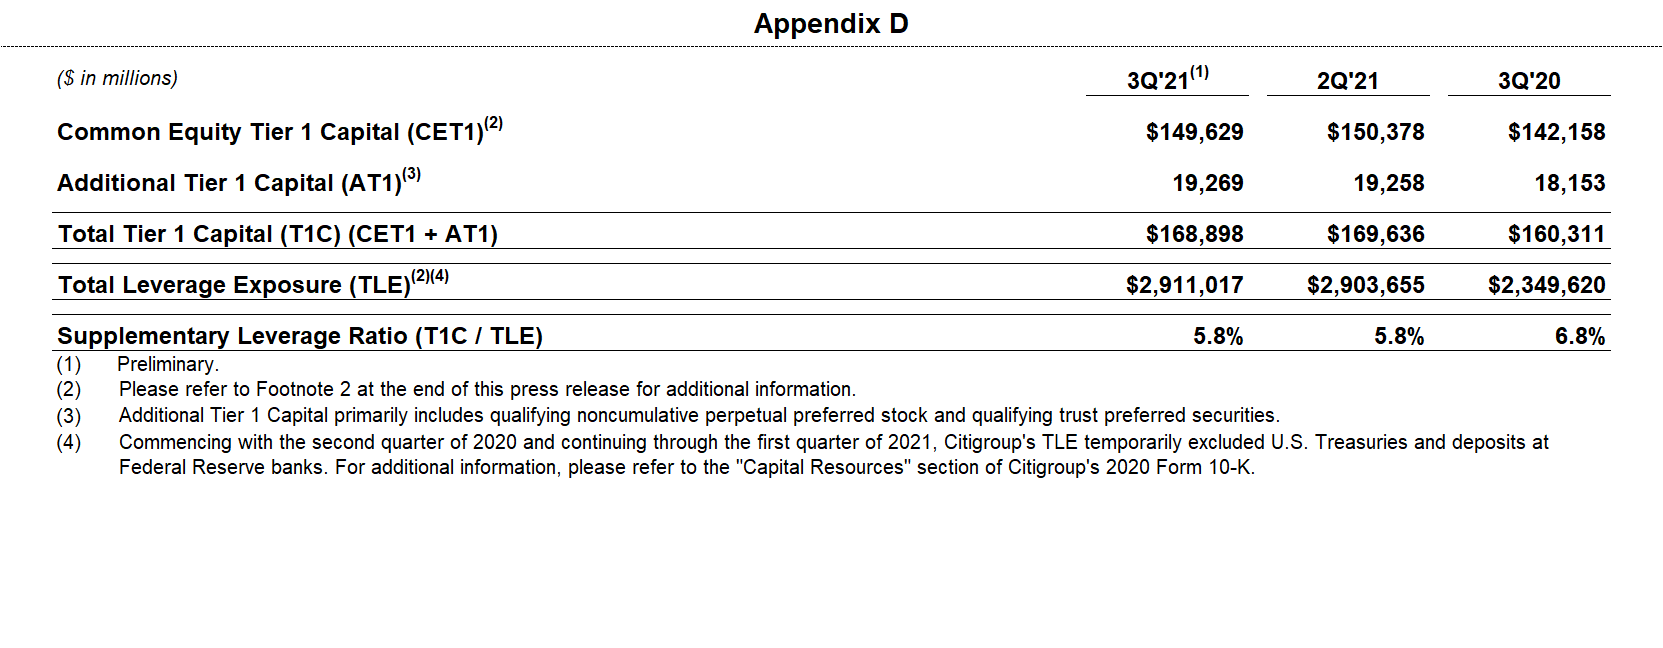
Citigroup's book value per share of $92.16 and tangible book value per share of $79.07 increased 9% and 10%, respectively, largely driven by net income. At quarter end, Citigroup's CET1 Capital ratio was 11.7%, a decrease from the prior quarter. Citigroup's SLR for the third quarter 2021 was 5.8%, unchanged from the prior quarter. During the quarter, Citigroup repurchased 43 million common shares and returned a total of $4.0 billion to common shareholders in the form of common share repurchases and dividends.
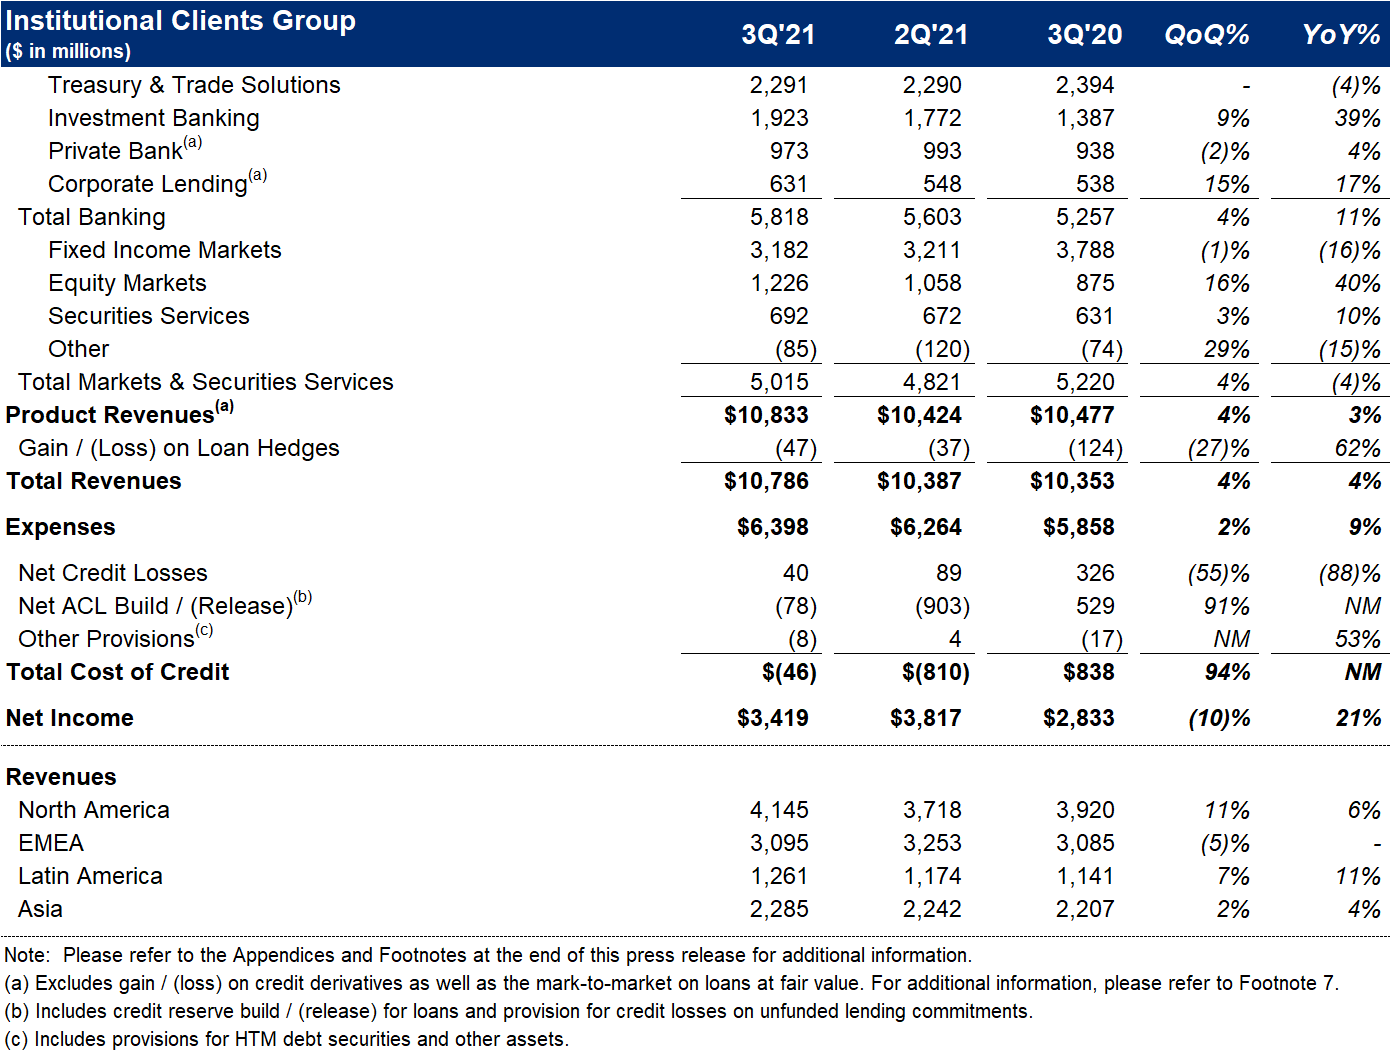
Institutional Clients Group
ICG revenues of $10.8 billion increased 4%, primarily driven by higher revenues in Investment Banking, Equity Markets and Securities Services, partially offset by declines in Fixed Income Markets and Treasury and Trade Solutions.
Banking revenues of $5.8 billion increased 12% versus the prior year (including gain / (loss) on loan hedges)7. Treasury and Trade Solutions revenues of $2.3 billion declined 4% on a reported basis and 5% in constant dollars, as higher fee revenues, a recovery in commercial card revenues and growth in trade were more than offset by the impact of lower deposit spreads. Investment Banking revenues of $1.9 billion increased 39%, reflecting strong growth across products. Debt underwriting revenues increased 19% to $877 million, Equity underwriting revenues increased 5% to $507 million, and Advisory revenues increased significantly to $539 million. Private Bank revenues of $973 million increased 4% (excluding gain / (loss) on loan hedges), driven by higher fees and lending volumes, reflecting momentum with both new and existing clients, partially offset by lower deposit spreads. Corporate Lending revenues of $631 million increased 17% (excluding gain / (loss) on loan hedges), primarily driven by lower cost of funds and a modest gain on sale, partially offset by lower volumes.
Markets and Securities Services revenues of $5.0 billion decreased 4%. Fixed Income Markets revenues of $3.2 billion decreased 16% reflecting the continued normalization in market activity across rates and spread products. Equity Markets revenues of $1.2 billion increased 40%, driven by derivatives, prime finance and cash equities, reflecting solid client activity and favorable market conditions. Securities Services revenues of $692 million increased 10% on a reported basis and 9% in constant dollars, driven by strong growth in fee revenues with both new and existing clients, driven by growth in assets under custody and settlement volumes, partially offset by lower deposit spreads.
ICG operating expenses of $6.4 billion increased 9%, reflecting continued investments in Citi's transformation, business-led investments and revenue-related expenses, partially offset by efficiency savings.
ICG cost of credit included net credit losses of $40 million, compared to $326 million in the prior-year period, and a net ACL release of $78 million compared to a build of $529 million in the prior-year period. The net ACL release in the current quarter primarily reflected improvements in portfolio credit quality.
ICG net income of $3.4 billion increased 21%, as the lower cost of credit and the higher revenues more than offset the higher expenses.
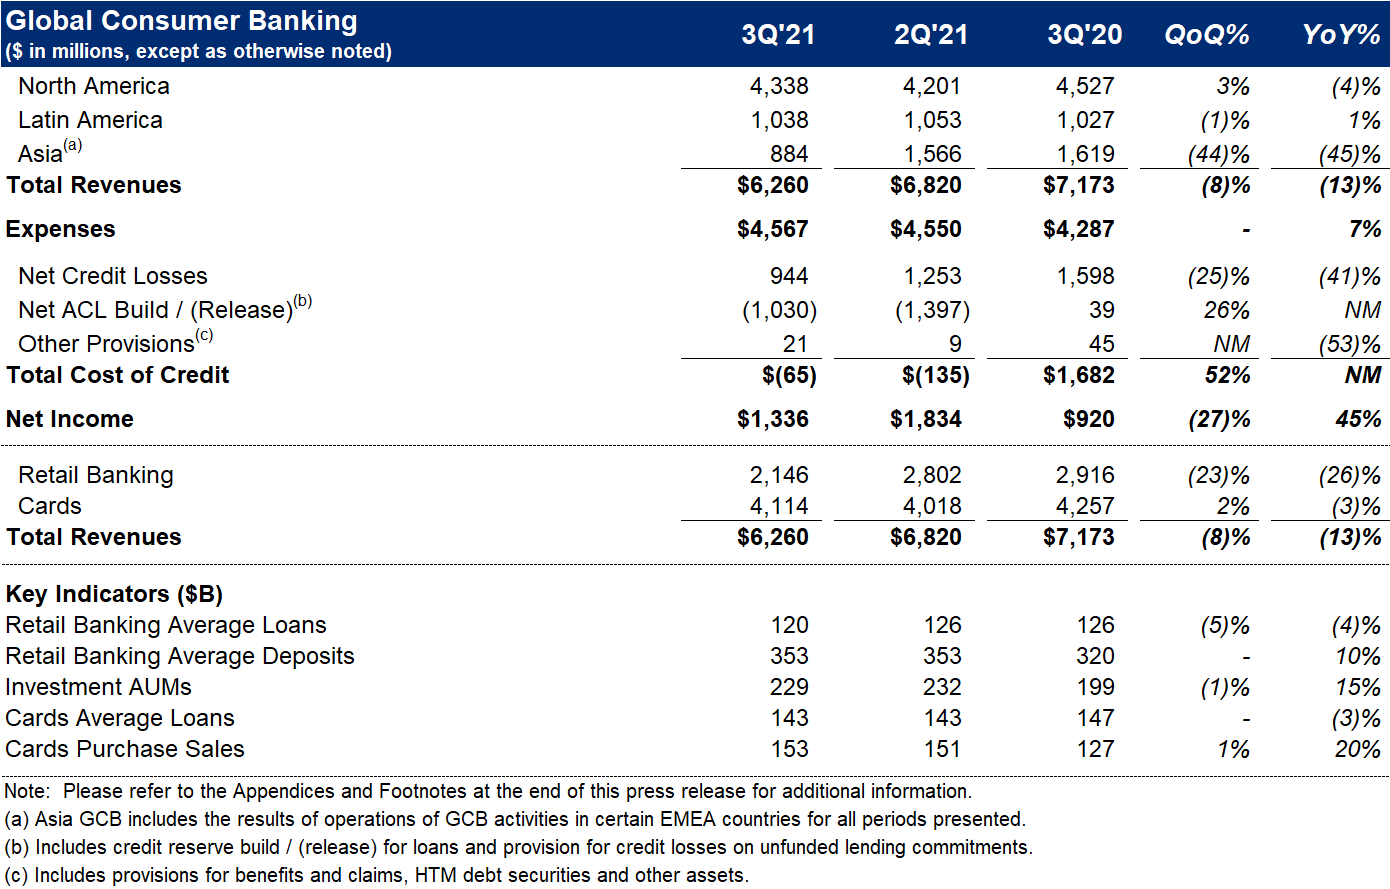
Global Consumer Banking
GCB revenues of $6.3 billion decreased 13% on a reported basis and 14% in constant dollars. On this basis and excluding the Australia loss on sale, revenues decreased 5%, as continued solid deposit growth and momentum in investment management were more than offset by lower card balances and deposit spreads.
North America GCB revenues of $4.3 billion decreased 4%. Citi-Branded Cards revenues of $2.0 billion decreased 1%, reflecting continued higher payment rates. Citi Retail Services revenues of $1.3 billion decreased 6%, reflecting lower average loans and continued higher payment rates. Retail Banking revenues of $1.0 billion decreased 7%, as the benefit of strong deposit growth was more than offset by lower deposit spreads, as well as lower mortgage revenues.
Latin America GCB revenues of $1.0 billion increased 1% on a reported basis. In constant dollars, revenues decreased 7%, driven by lower lending volumes and deposit spreads, partially offset by growth in assets under management.
Asia GCB revenues of $0.9 billion decreased 45% on a reported basis and 46% in constant dollars. On this basis, and excluding the Australia loss on sale, revenues decreased 4%, reflecting lower loans and deposit spreads, partially offset by higher investment revenues.
GCB operating expenses of $4.6 billion increased 7% on a reported basis and 5% in constant dollars, reflecting continued investments in Citi's transformation, as well as business-led investments and volume-related expenses, partially offset by efficiency savings.
GCB cost of credit of $(65) million compared to $1.7 billion in the prior-year period, driven by a net ACL release of $1.0 billion compared to a modest build in the prior-year period, reflecting improvements in both portfolio credit quality and the macroeconomic outlook, as well as lower net credit losses.
GCB net income of $1.3 billion increased significantly, as the lower cost of credit more than offset the decline in revenues and the higher expenses.
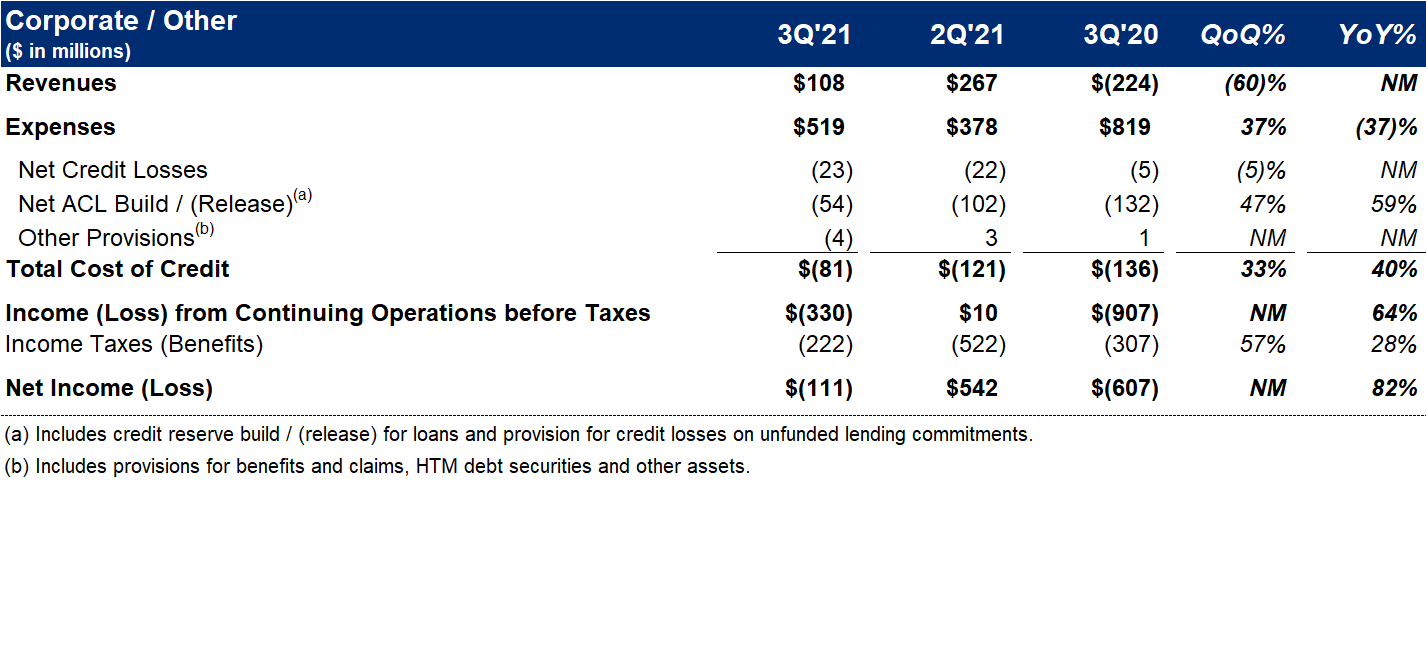
Corporate / Other
Corporate / Other revenues of $108 million increased significantly, reflecting higher net revenue from the investment portfolio.
Corporate / Other expenses of $519 million decreased 37%, primarily due to the absence of a civil money penalty incurred in the prior-year period, partially offset by an increase in expenses related to Citi's transformation.
Corporate / Other loss from continuing operations before taxes of $(330) million compared to a loss of $(907) million in the prior-year period, driven by the higher revenues and the lower expenses, partially offset by a lower net ACL release.
Citigroup will host a conference call today at 10 a.m. (ET). A live webcast of the presentation, as well as financial results and presentation materials, will be available at https://www.citigroup.com/global/investors. Dial-in numbers for the conference call are as follows: (866) 516-9582 in the U.S. and Canada; (973) 409-9210 outside of the U.S. and Canada. The conference code for both numbers is 2976824.
Additional financial, statistical and business-related information, as well as business and segment trends, is included in a Quarterly Financial Data Supplement. Both this earnings release and Citigroup's Third Quarter 2021 Quarterly Financial Data Supplement are available on Citigroup's website at www.citigroup.com.
Citi
Contacts: