
Fourth Quarter and Full Year 2022 Results and Key Metrics
HIGHLIGHTS
- Returned $1.0 Billion in Dividends to Common Shareholders; Payout Ratio of 44%3
- Book Value per Share of $94.06
- Tangible Book Value per Share of $81.654
Read the full press release with tables and CEO commentary.
View the Financial Supplement (PDF)
View Financial Supplement (Excel)
New York – Citigroup Inc. today reported net income for the fourth quarter 2022 of $2.5 billion, or $1.16 per diluted share, on revenues of $18.0 billion. This compares to net income of $3.2 billion, or $1.46 per diluted share, on revenues of $17.0 billion for the fourth quarter 2021.
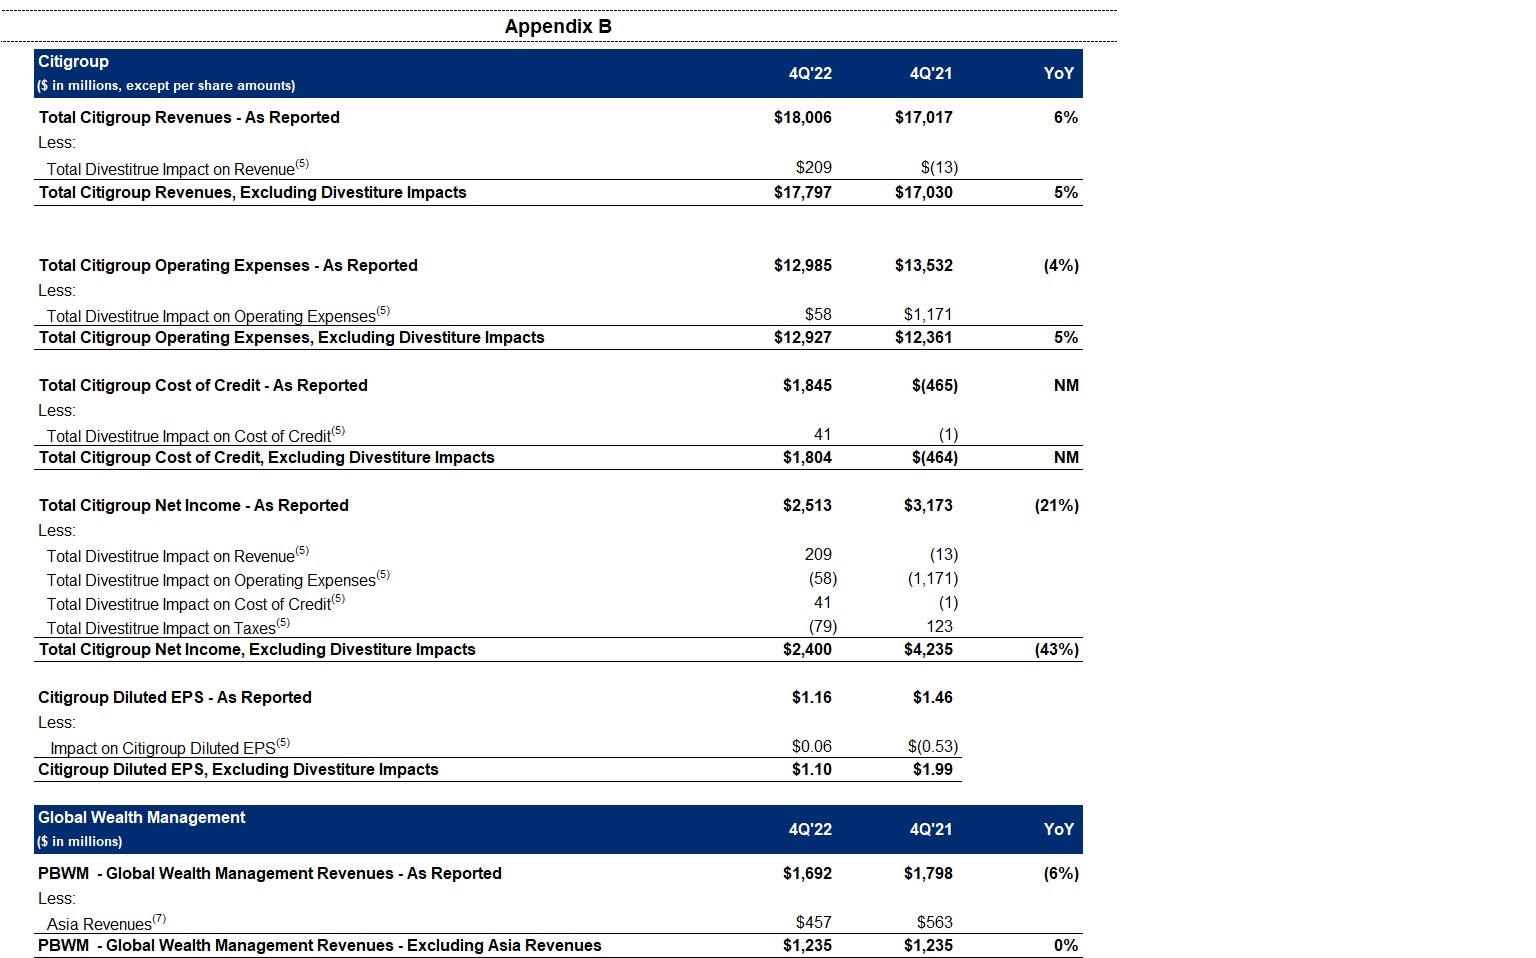
Fourth quarter results included divestiture-related impacts of approximately $192 million in earnings before taxes (approximately $113 million after-tax), primarily driven by a gain on the sale of the Thailand consumer business. Excluding these divestiture-related impacts, earnings per share was $1.10(5). This compares to divestiture-related impacts in the fourth quarter 2021 of approximately $1.2 billion in earnings before taxes (approximately $1.1 billion after-tax), primarily driven by costs related to the Korea voluntary early retirement program (VERP)(5).
Revenues increased 6% from the prior-year period and 5% excluding the divestiture-related impacts(5), as growth in net interest income was partially offset by lower non-interest revenues. The higher net interest income was driven by the impact of higher interest rates across businesses and strong loan growth in Personal Banking and Wealth Management (PBWM). The lower non-interest revenues reflected declines in Investment Banking in Institutional Clients Group (ICG) and lower investment product revenues in Global Wealth Management in PBWM.
Net income of $2.5 billion decreased 21% from the prior-year period, and decreased 43% excluding the divestiture-related impacts, primarily driven by higher cost of credit, largely resulting from the loan growth in PBWM and deterioration in macroeconomic assumptions, partially offset by the higher revenues and lower expenses.
Earnings per share of $1.16 decreased 21% from the prior-year period, reflecting the lower net income, partially offset by an approximate 2% decline in average diluted shares outstanding.
For the full year 2022, Citigroup reported net income of $14.8 billion on revenues of $75.3 billion, compared to net income of $22.0 billion on revenues of $71.9 billion for the full year 2021.
Citi CEO Jane Fraser said, “One of our major goals in 2022 was to put in place a strategic plan designed to create long-term value for our shareholders and I am pleased with the significant progress we have already made in terms of our Transformation, simplification and strengthening our five interconnected businesses, some of which delivered excellent results this quarter.
“With their revenues up 32%, Services delivered another excellent quarter, and we have gained significant share in both Treasury and Trade Solutions and Securities Services. Markets had the best fourth quarter in recent memory, driven by a 31% increase in Fixed Income, while Banking and Wealth Management were impacted by the same market conditions they faced throughout the year. Our cards businesses had double-digit revenue growth for the second straight quarter, and we continue to make progress on our international consumer exits, closing five sales to date.
“Over the course of 2022, we returned over $7 billion to our shareholders. We ended the year with a CET1 capital ratio of 13% and a tangible book value per share of $81.65. We intentionally designed a strategy that can deliver for our shareholders in different environments, and we are very much on track to reach the medium-term return targets we shared on Investor Day,” Ms. Fraser concluded.
Percentage comparisons throughout this press release are calculated for the fourth quarter 2022 versus the fourth quarter 2021, unless otherwise specified.
Fourth Quarter Financial Results
Citigroup
Citigroup revenues of $18.0 billion in the fourth quarter 2022 increased 6%. Excluding the divestiture-related impacts, primarily driven by the gain on the sale of the Thailand consumer business in the current quarter, revenues were up 5%, as the impacts of higher interest rates across businesses and the strong loan growth in US Personal Banking were partially offset by the decline in Investment Banking and the lower investment product revenues in Global Wealth Management as well as impacts from the closed exit markets.
Citigroup operating expenses of $13.0 billion in the fourth quarter 2022 decreased 4%, primarily driven by the absence of divestiture-related costs related to the Korea VERP in the prior-year period. Operating expenses included approximately $58 million of divestiture-related costs in the current quarter, compared to approximately $1.2 billion in the prior-year period. Excluding these costs in both periods, expenses increased 5%, largely driven by transformation investments, business-led investments, and volume-related expenses, partially offset by the benefit of productivity savings and expense reduction of the market exits.
Citigroup cost of credit was approximately $1.8 billion in the fourth quarter 2022, compared to $(0.5) billion in the prior-year period, reflecting a net build in the allowance for credit losses (ACL) for loans and unfunded commitments of $640 million, primarily due to the loan growth in PBWM and the deterioration in macroeconomic assumptions, compared to a net ACL release of $(1.4) billion in the prior-year period. The higher cost of credit also reflected higher net credit losses, primarily driven by ongoing normalization in cards, particularly in Retail Services.
Citigroup net income of $2.5 billion in the fourth quarter 2022 decreased 21% from the prior-year period, primarily driven by the higher cost of credit, partially offset by the higher revenues and lower expenses. Citigroup’s effective tax rate was 20.2% in the current quarter versus 19.5% in the fourth quarter 2021.
Citigroup’s total allowance for credit losses on loans was approximately $17.0 billion at quarter end, with a reserve-to-funded loans ratio of 2.60%, compared to $16.5 billion, or 2.49% of funded loans, at the end of the prior-year period. Total non-accrual loans decreased 28% from the prior-year period to $2.4 billion. Consumer non-accrual loans decreased 28% to $1.3 billion and corporate non-accrual loans decreased 28% to $1.1 billion.
Citigroup's end-of-period loans were $657 billion at quarter end, down 2% versus the prior-year period, as the decline in Legacy Franchises more than offset growth in US Personal Banking and the impact of foreign exchange translation.
Citigroup's end-of-period deposits were $1.4 trillion at quarter end, an increase of 4% versus the prior-year period, largely driven by deposit growth in Treasury and Trade Solutions (TTS), partially offset by lower deposits in Legacy Franchises and the impact of foreign exchange translation.
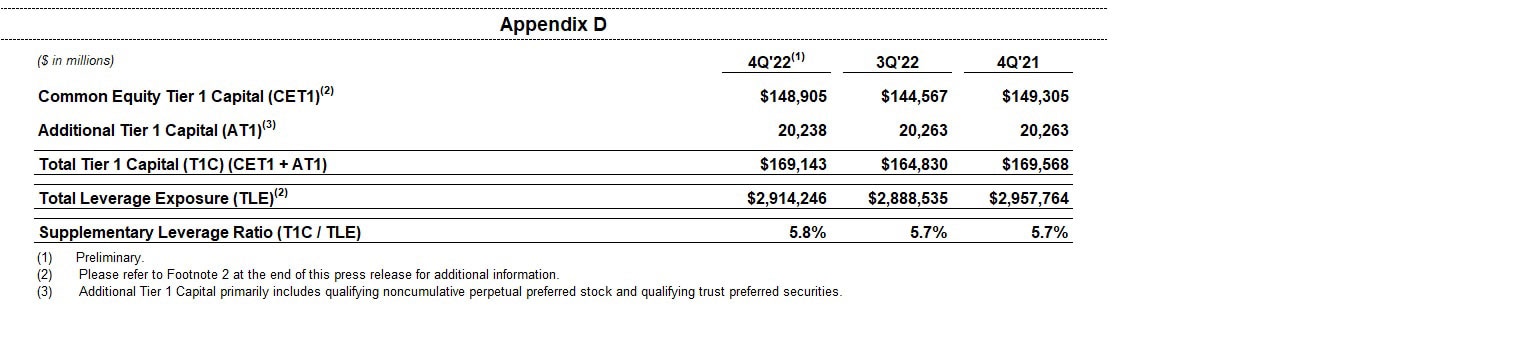
Citigroup's book value per share of $94.06 and tangible book value per share of $81.65 at quarter end increased 2% and 3%, respectively, largely driven by the net income and the lower shares outstanding, partially offset by adverse movements in the accumulated other comprehensive income (AOCI) component of equity and payment of common dividends. At quarter end, Citigroup’s CET1 capital ratio was 13.0% versus 12.3% in the prior quarter, largely reflecting the benefits of net income, closing of exit markets, and the optimization of risk-weighted assets (RWA). Citigroup’s Supplementary Leverage ratio for the fourth quarter 2022 was 5.8% versus 5.7% in the prior quarter. During the quarter, Citigroup returned a total of $1 billion to common shareholders in the form of dividends.

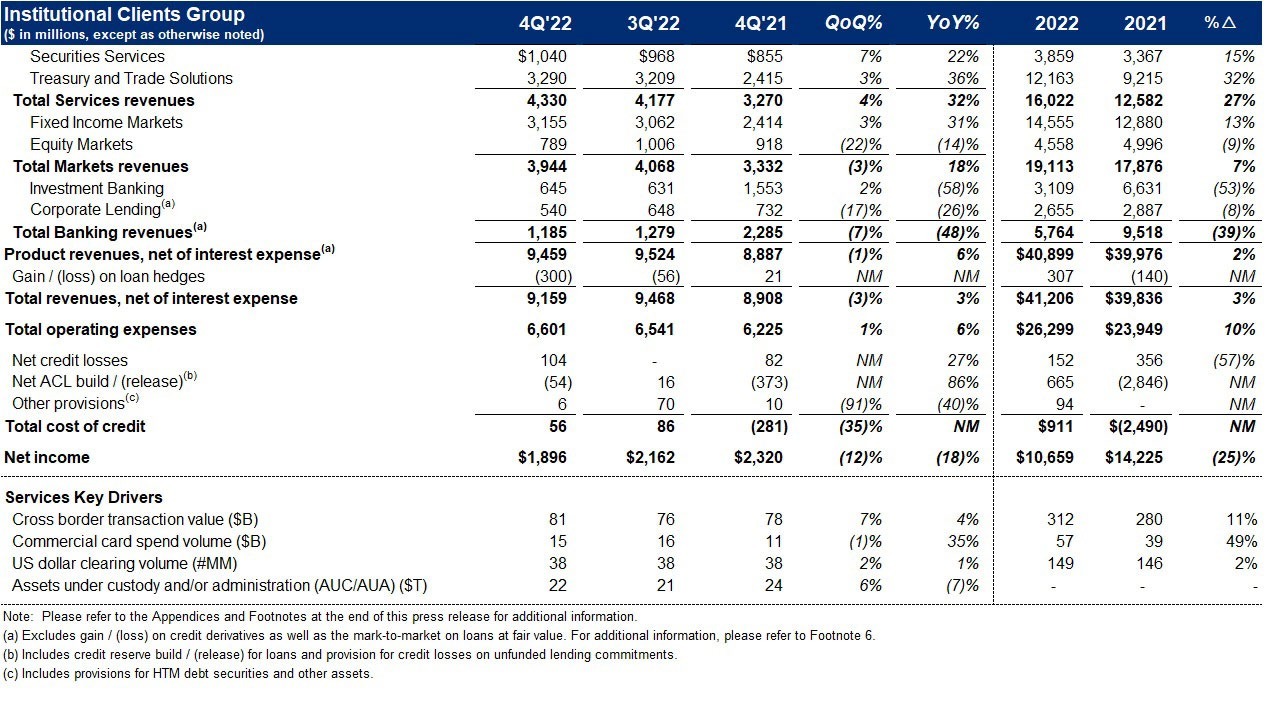
Institutional Clients Group
ICG revenues of $9.2 billion increased 3% (including gain/(loss) on loan hedges)(6), as strength in TTS, Securities Services and Fixed Income Markets was partially offset by a decline in Banking and Equity Markets.
Services revenues of $4.3 billion increased 32%. Treasury and Trade Solutions (TTS) revenues of $3.3 billion increased 36%, driven by 61% growth in net interest income, partially offset by a 1% decrease in non-interest revenue. Strong performance in TTS was driven by business actions, which included managing deposit repricing, deepening of relationships with existing clients, and significant new client wins across all segments, as well as the benefit of higher interest rates. Securities Services revenues of $1.0 billion increased 22%, as net interest income increased significantly, driven by higher interest rates across currencies, partially offset by a 9% decrease in non-interest revenue due to the impact of lower market valuations on assets under custody and administration.
Markets revenues of $3.9 billion increased 18%, largely driven by growth in Fixed Income Markets. Fixed Income Markets revenues of $3.2 billion increased 31%, driven by strength in rates and currencies. Equity Markets revenues of $789 million were down 14%, primarily reflecting reduced client activity in equity derivatives, partially offset by growth in prime services.
Banking revenues of $0.9 billion decreased 62%, including gain/losses on loan hedges in the current quarter and the prior-year period. Excluding gain/losses on loan hedges, Banking revenues of $1.2 billion decreased 48%, driven by lower revenues in Investment Banking and Corporate Lending. Investment Banking revenues of $645 million decreased 58%, as heightened macroeconomic uncertainty and volatility continued to impact client activity. Excluding gain/losses on loan hedges, Corporate Lending revenues decreased 26% versus the prior-year period, driven by lower volumes, higher credit default swap premiums, and impacts of foreign exchange translation.
ICG operating expenses of $6.6 billion increased 6%, driven by transformation investments, business-led investments, and volume-related expenses, partially offset by the impacts of foreign exchange translation and productivity savings.revenue-related expenses, partially offset by efficiency savings.
ICG cost of credit of $56 million, compared to $(281) million in the prior-year period, included a net ACL release for loans and unfunded commitments of $(54) million and net credit losses of $104 million. The ACL release was primarily driven by the reduction of certain direct exposures in Russia, partially offset by an increase related to the deterioration in macroeconomic assumptions.
ICG net income of $1.9 billion decreased 18%, largely driven by the higher expenses and the higher cost of credit, partially offset by the higher revenues.
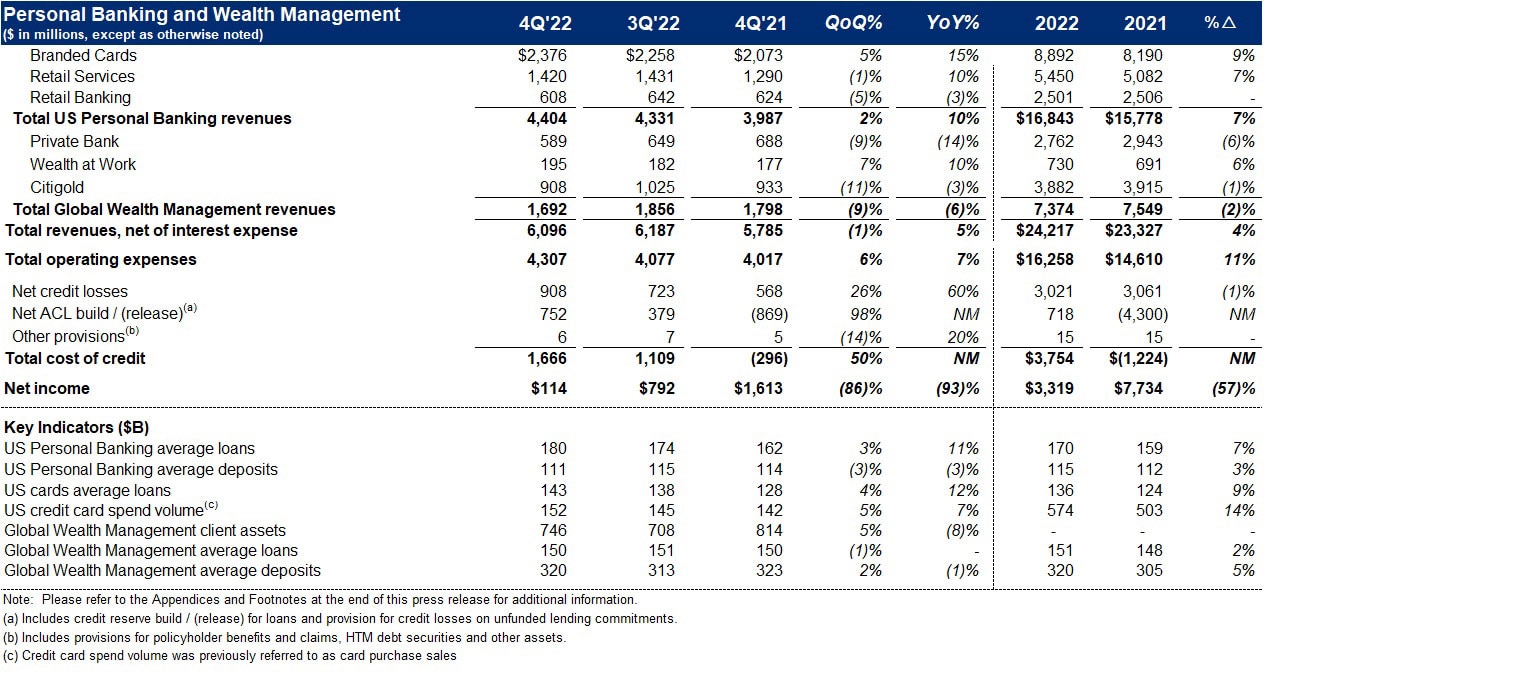
Personal Banking and Wealth Management
PBWM revenues of $6.1 billion increased 5%, as net interest income growth, driven by strong loan growth across US Personal Banking and higher interest rates, was partially offset by a decline in non-interest revenue, driven by the lower investment product revenues in Global Wealth Management and higher partner payments in Retail Services.
US Personal Banking revenues of $4.4 billion increased 10%. Branded Cards revenues of $2.4 billion increased 15%, primarily driven by the higher net interest income. In Branded Cards, card spend volumes increased 9% and average loans increased 13%. Retail Services revenues of $1.4 billion increased 10%, driven by higher interest-earning balances, partially offset by the higher partner payments. Retail Banking revenues of $608 million decreased 3%, primarily driven by lower mortgage volumes.
Global Wealth Management revenues of $1.7 billion decreased 6%, as investment product revenue headwinds, more than offset net interest income growth from the higher interest rates particularly in Asia. Excluding Asia(7), revenues were largely unchanged.
PBWM operating expenses of $4.3 billion increased 7%, primarily driven by transformation investments and other risk and control initiatives.
PBWM cost of credit was $1.7 billion compared to $(296) million in the prior-year period. The increase was largely driven by a net build in the ACL for loans and unfunded commitments of $752 million in the current quarter, primarily driven by cards volume growth and the deterioration in macroeconomic assumptions, compared to a net ACL release of $869 million in the prior-year period. Net credit losses of $908 million increased 60% from near historically low levels, reflecting ongoing normalization, particularly in Retail Services.
PBWM net income of $114 million decreased 93%, driven by the higher cost of credit and the higher expenses, partially offset by the higher revenues.
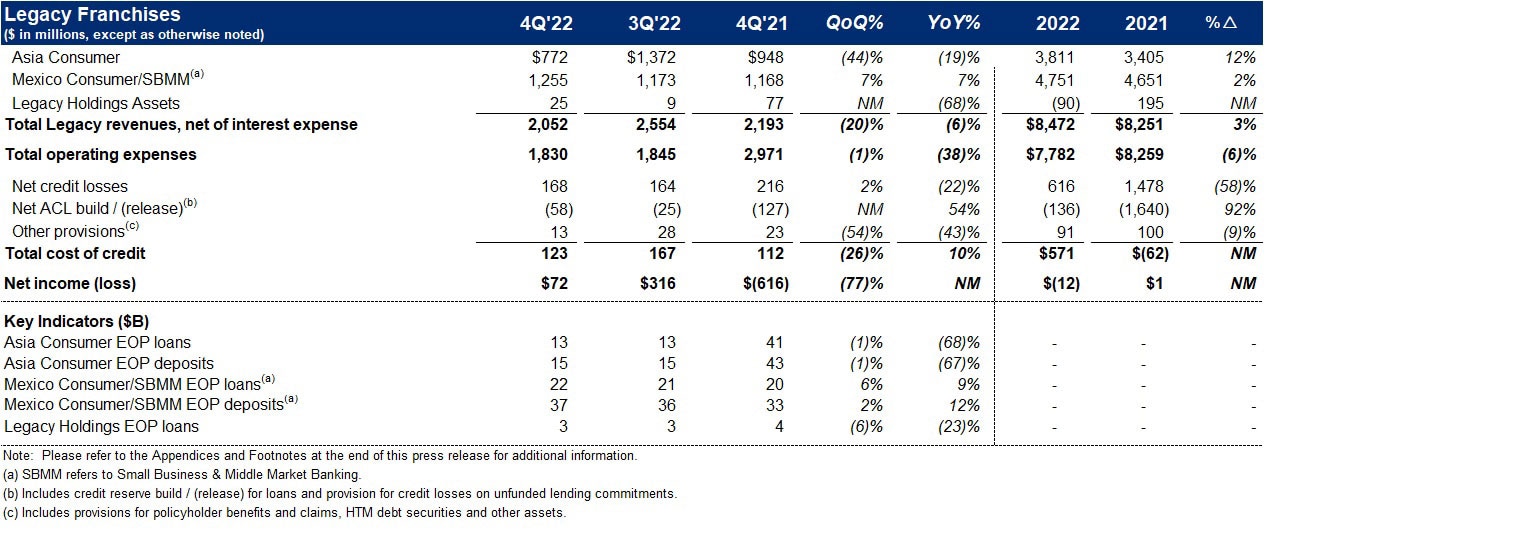
Legacy Franchises
Legacy Franchises revenues of $2.1 billion decreased 6%, primarily driven by the reduction in revenues from the closing of five exit markets and the impact of the Korea consumer and Russia consumer wind-downs, partially offset by the Thailand consumer business gain on sale.
Legacy Franchises expenses of $1.8 billion decreased 38%, driven by the absence of the $1.2 billion divestiture-related costs in the prior-year period and the benefits from exit markets.
Legacy Franchises cost of credit was $123 million, compared to $112 million in the prior-year period, primarily driven by a larger net ACL release for loans and unfunded commitments in the prior-year period, partially offset by lower net credit losses in the current quarter.
Legacy Franchises net income was $72 million, compared to a net loss of $616 million in the prior-year period, primarily reflecting the lower expenses, partially offset by the lower revenues.
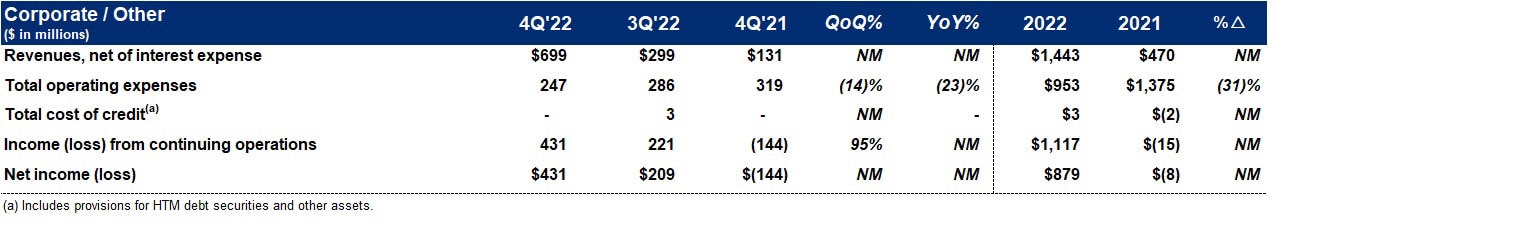
Corporate / Other
Corporate / Other revenues increased to $699 million from $131 million in the prior-year period, largely driven by higher net revenue from the investment portfolio, primarily due to higher interest rates.
Corporate / Other expenses expenses of $247 million decreased 23%, driven by lower consulting expenses.
Corporate / Other loss from continuing operations before taxes was $431 million, compared to a loss of $144 million in the prior-year period, reflecting the higher net revenue from the investment portfolio and the lower expenses.
Citigroup will host a conference call today at 11 a.m. (ET). ). A live webcast of the presentation, as well as financial results and presentation materials, will be available at www.citigroup.com/global/investors. Dial-in numbers for the conference call are as follows: (800) 343-1703 (for U.S. and Canada callers) or (785) 424-1226 (for international callers).
Additional financial, statistical and business-related information, as well as business and segment trends, is included in a Quarterly Financial Data Supplement. Both this earnings release and Citigroup’s Fourth Quarter 2022 Quarterly Financial Data Supplement are available on Citigroup’s website at www.citigroup.com.
Citi
Citi is a preeminent banking partner for institutions with cross-border needs, a global leader in wealth management and a valued personal bank in its home market of the United States. Citi does business in nearly 160 countries and jurisdictions, providing corporations, governments, investors, institutions and individuals with a broad range of financial products and services.
Additional information may be found at www.citigroup.com | Twitter: @Citi | YouTube: www.youtube.com/citi | Blog: http://blog.citigroup.com | Facebook: www.facebook.com/citi | LinkedIn: www.linkedin.com/company/citi
Certain statements in this release are “forward-looking statements” within the meaning of the rules and regulations of the Private Securities Litigation and Reform Act of 1995. These statements are based on management’s current expectations and are subject to uncertainty and changes in circumstances. These statements are not guarantees of future results or occurrences. Actual results and capital and other financial condition may differ materially from those included in these statements due to a variety of factors. These factors include, among others: continued elevated levels of inflation and its impacts; elevated interest rates and the impacts on macroeconomic conditions, customer and client behavior, as well as Citi’s funding costs; global supply shocks; potential recessions in Europe, the U.S. and other countries; significant disruptions and volatility in financial markets, including foreign currency volatility and devaluations; economic and geopolitical challenges related to China; the impacts related to or resulting from the Russia-Ukraine war, including Citi’s ability to wind-down its activities in Russia; Citi’s ability to execute against its transformation milestones and strategic initiatives, including consummation of Citi’s exits and wind-downs, and the impacts related to any additional CTA or other losses and impacts; macroeconomic and other challenges and uncertainties related to the COVID-19 pandemic, including disruptions of global supply chains; and the precautionary statements included in this release. These factors also consist of those contained in Citigroup’s filings with the U.S. Securities Exchange and Commission, including without limitation the “Risk Factors” section of Citigroup’s 2021 Form 10-K. Any forward-looking statements made by or on behalf of Citigroup speak only as to the date they are made, and Citi does not undertake to update forward-looking statements to reflect the impact of circumstances or events that arise after the date the forward-looking statements were made.
Contacts:
Investors: Jennifer Landis (212) 559-2718
Press: Danielle Romero-Apsilos (212) 816-2264
Click here for the complete press release and summary financial information.
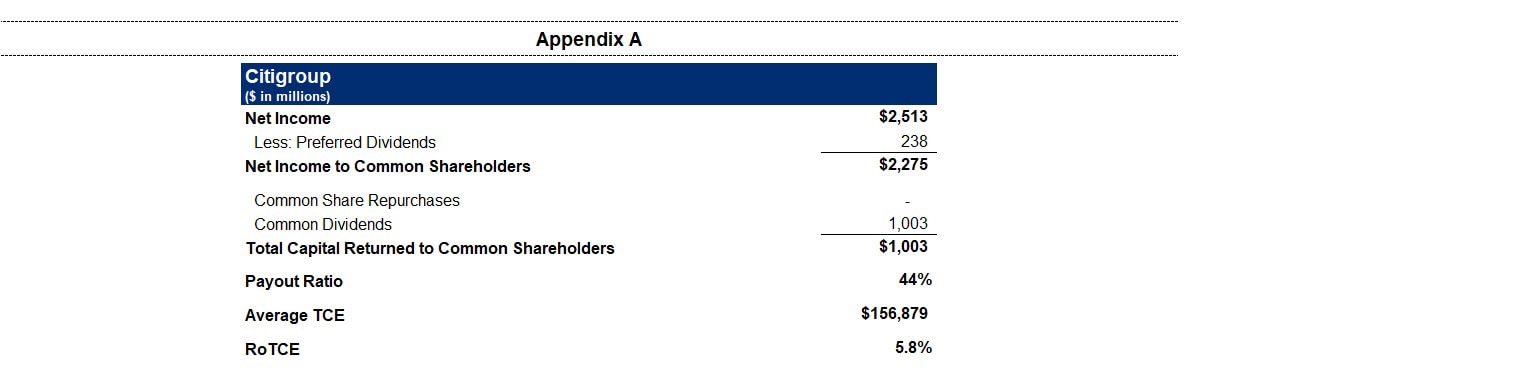


1 Preliminary. Citigroup’s return on average tangible common equity (RoTCE) is a non-GAAP financial measure. RoTCE represents annualized net income available to common shareholders as a percentage of average tangible common equity (TCE). For the components of the calculation, see Appendix A.
2Ratios as of December 31, 2022 are preliminary. Citigroup’s Common Equity Tier 1 (CET1) Capital ratio and Supplementary Leverage ratio (SLR) reflect certain deferrals based on the modified regulatory capital transition provision related to the Current Expected Credit Losses (CECL) standard. Excluding these deferrals, Citigroup’s CET1 Capital ratio and SLR as of December 31, 2022 would be 12.8% and 5.7%, respectively, on a fully reflected basis. For additional information, see “Capital Resources—Regulatory Capital Treatment—Modified Transition of the current expected” in Citigroup’s Annual Report on Form 10-K for the year ended December 31, 2021, and Citigroup's Current Report on Form 8-K dated May 10, 2022 (as amended by Current Report on Form 8-K/A dated May 10, 2022).
For the composition of Citigroup’s CET1 Capital and ratio, see Appendix C. For the composition of Citigroup’s SLR, see Appendix D.
3 Citigroup’s payout ratio is the sum of common dividends and common share repurchases divided by net income available to common shareholders. For the components of the calculation, see Appendix A.
4 Citigroup’s tangible book value per share is a non-GAAP financial measure. For a reconciliation of this measure to reported results, see Appendix E.
5 Fourth quarter 2022 results included divestiture-related impacts of $192 million in earnings before taxes (approximately $113 million after-tax), primarily recorded in Legacy Franchises. This amount included $209 million primarily related to the gain on sale from certain divestitures, recorded in Other revenue, $58 million of aggregate divestiture-related costs, recorded in Operating expenses, a $41 million benefit of divestiture-related credit costs, and related taxes of $79 million.
Fourth quarter 2021 results included divestiture-related impacts of $(1.2) billion in earnings before taxes (approximately $1.1 billion after tax), recorded in Legacy Franchises. This amount included $1.2 billion recorded in Operating expenses related to the Korea voluntary early retirement program (VERP) as well as contract modification costs related to the divestitures of approximately $119 million. In addition, this amount included a pre-tax true-up loss of approximately $13 million related to the sale of the Australia consumer business recorded in Other revenue, a $(1) million benefit of divestiture-related credit costs, and a tax benefit of $123 million. For additional information about the Korea VERP, see Citigroup’s Current Report on Form 8-K filed with the SEC on October 25, 2021 and Citigroup’s Current Report on Form 8-K/A filed with the SEC on November 8, 2021.
Results of operations excluding these divestiture-related impacts are non-GAAP financial measure. For a reconciliation to reported results, please refer to Appendix B.
6 Credit derivatives are used to economically hedge a portion of the Corporate Loan portfolio that includes both accrual loans and loans at fair value. Gains / (losses) on loan hedges includes the mark-to-market on the credit derivatives and the mark-to-market on the loans in the portfolio that are at fair value. In the fourth quarter 2022, gains / (losses) on loan hedges included $(300) million related to Corporate Lending, compared to $21 million in the prior-year period. The fixed premium costs of these hedges are netted against the Corporate Lending revenues to reflect the cost of credit protection. Citigroup’s results of operations excluding the impact of gains / (losses) on loan hedges are non-GAAP financial measures.
7 Global Wealth Management revenues in Asia were $457 million for the fourth quarter 2022 and $563 million for the fourth quarter 2021. Results of operations for Global Wealth Management excluding revenues in Asia are non-GAAP financial measures. For a reconciliation to reported results, please refer to Appendix B .