Second Quarter 2023 Results and Key Metrics
HIGHLIGHTS
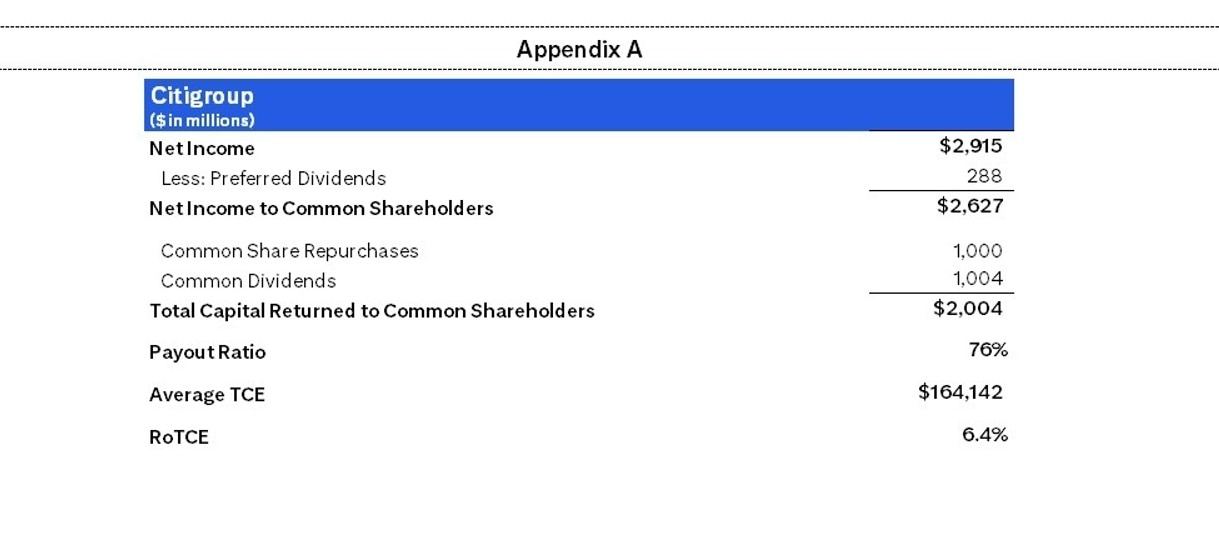
- RETURNED $2.0 BILLION IN THE FORM OF DIVIDENDS AND REPURCHASES
- PAYOUT RATIO OF 76%3
- BOOK VALUE PER SHARE OF $97.87
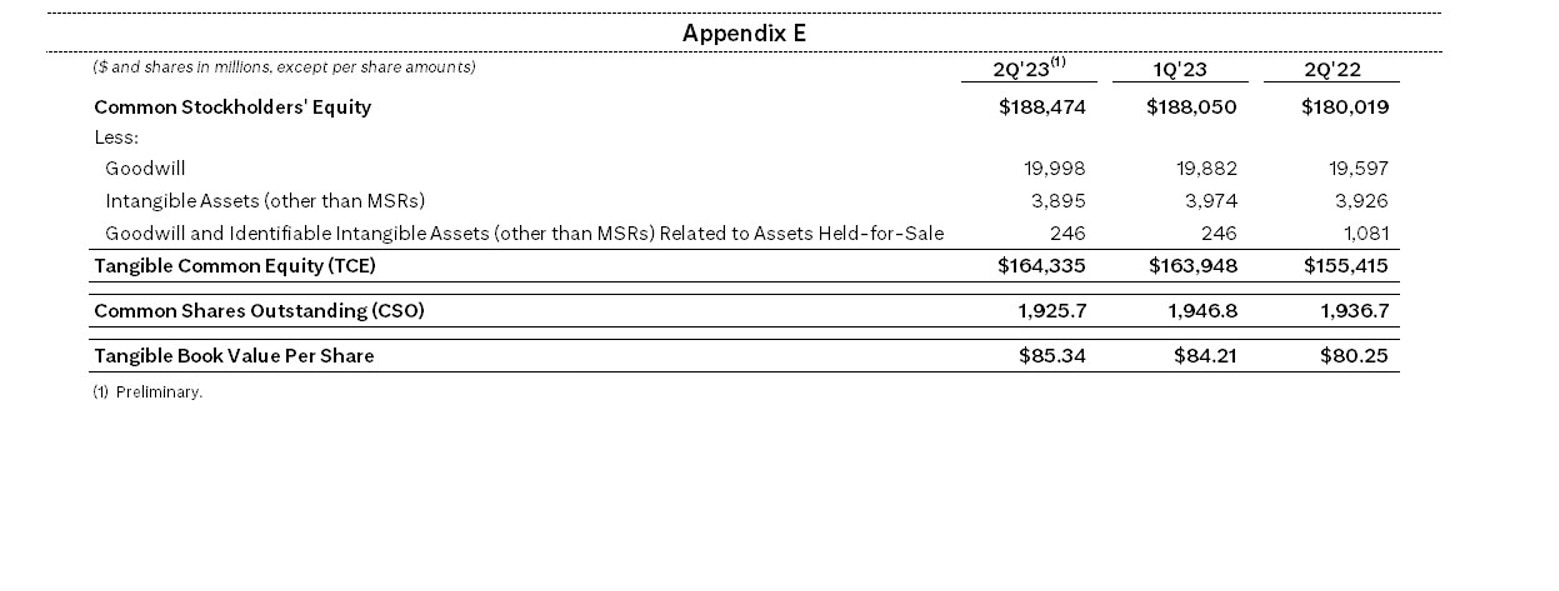
- TANGIBLE BOOK VALUE PER SHARE OF $85.344
Read the full press release with tables and CEO commentary
View the Financial Supplement (PDF)
View Financial Supplement (Excel)
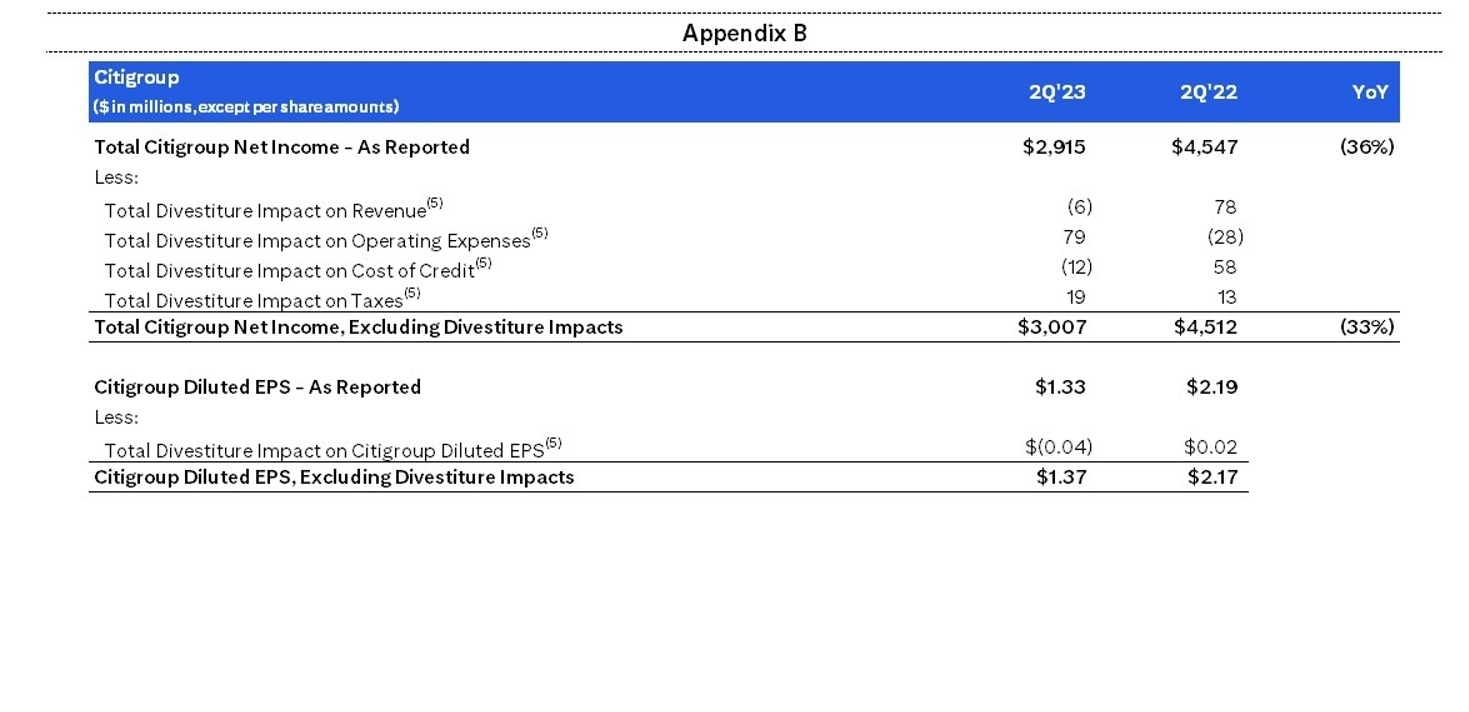
New York, July 14, 2023 – Citigroup Inc. today reported net income for the second quarter 2023 of $2.9 billion, or $1.33 per diluted share, on revenues of $19.4 billion. This compares to net income of $4.5 billion, or $2.19 per diluted share, on revenues of $19.6 billion for the second quarter 2022.
Second quarter results included divestiture-related impacts of $(73) million5 in earnings before taxes ($(92) million after-tax), primarily driven by separation costs related to Mexico and severance costs in Asia exit markets, which were both recorded in Legacy Franchises. Excluding these divestiture-related impacts, earnings per share was $1.375. This compares to divestiture-related impacts in the second quarter 2022 of $48 million5 in earnings before taxes ($35 million after-tax), also recorded in Legacy Franchises, and earnings per share in the second quarter of 2022, excluding divestiture-related impacts, of $2.175.
Revenues decreased 1% from the prior-year period, as growth in Services in Institutional Clients Group (ICG) and US Personal Banking within Personal Banking and Wealth Management (PBWM) was more than offset by a decline in Markets and Investment Banking in ICG and Global Wealth Management in PBWM, as well as the revenue reduction from exited markets and wind-downs within Legacy Franchises. The decline in revenues was also partially offset by higher revenues in Corporate / Other.
Net income of $2.9 billion decreased 36% from the prior-year period. Excluding divestiture-related impacts5, net income decreased 33%. The decrease in net income was primarily driven by higher expenses, higher cost of credit and the lower revenues.
Earnings per share of $1.33 decreased 39% from the prior-year period, reflecting the lower net income and an approximate 1% increase in average diluted shares outstanding.
Citi CEO Jane Fraser said, “Amid a challenging macroeconomic backdrop, we continued to see the benefits of our diversified business model and strong balance sheet. Our Services businesses continued to deliver strong revenues, with Treasury and Trade Solutions and Securities Services both up a healthy 15%. Markets revenues were down from a strong second quarter last year, as clients stood on the sidelines starting in April while the U.S. debt limit played out. In Banking, the long-awaited rebound in Investment Banking has yet to materialize, making for a disappointing quarter.
“Our Cards businesses had double-digit growth due to strong engagement and continued normalization in payment rates. And while Wealth revenues were down, we are attracting new clients and seeing growth in segments such as Wealth at Work.
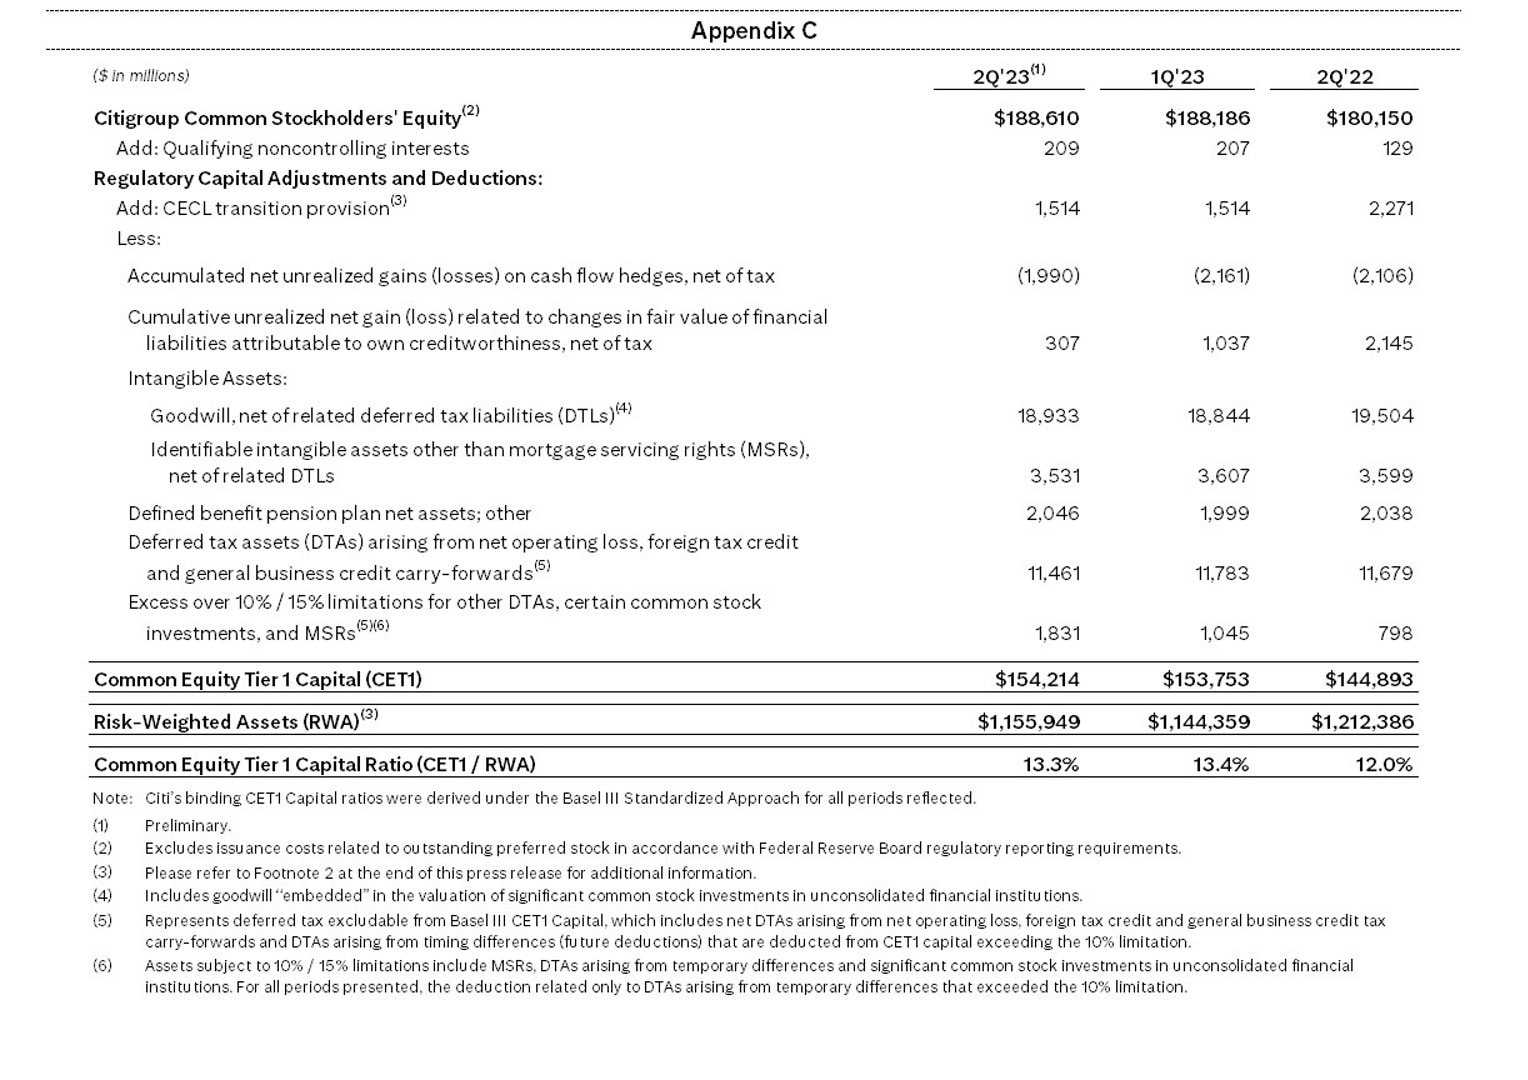
“We remain laser-focused on executing our strategy while continuing to simplify and modernize our bank. We are on track with the plan we laid out at Investor Day and remain committed to reaching our medium-term return targets. We ended the second quarter with a CET 1 ratio of 13.3%, which was 100 basis points above our new regulatory requirement that goes into effect in the fourth quarter. We returned a total of $2 billion in capital to our shareholders through common dividends and share buybacks and we will continue to review our level of capital return on a quarter-to-quarter basis,” Ms. Fraser concluded.
Percentage comparisons throughout this press release are calculated for the second quarter 2023 versus the second quarter 2022, unless otherwise specified.
Second Quarter Financial Results
Citigroup
Citigroup revenues of $19.4 billion in the second quarter 2023 decreased 1%. The lower revenues reflected strength across Services and US Personal Banking which was more than offset by declines in Markets, Investment Banking, and Global Wealth Management, as well as the revenue reduction from the exited markets and continued wind-downs. The decline in revenues was also partially offset by higher revenues in Corporate / Other.
Citigroup operating expenses of $13.6 billion in the second quarter 2023 increased 9%, largely driven by investments in risk and control, business-led and enterprise-led investments, volume growth and macro factors, including inflation, as well as severance. The expense increase was partially offset by productivity savings and an expense reduction from the exited markets and continued wind-downs.
Citigroup cost of credit was approximately $1.8 billion in the second quarter 2023, compared to $1.3 billion in the prior-year period, primarily driven by the continued normalization in net credit losses. A net build in the allowance for credit losses (ACL) for loans and unfunded commitments of $161 million was primarily driven by Branded Cards and Retail Services, largely related to growth in card balances. Additionally, other provisions were $159 million in the quarter.
Citigroup net income of $2.9 billion in the second quarter 2023 decreased 36% from the prior-year period, primarily driven by the higher expenses and the higher cost of credit, as well as the lower revenues. Citigroup’s effective tax rate increased to approximately 27% in the current quarter versus 20% in the second quarter 2022, largely driven by the geographic mix of earnings.
Citigroup’s total allowance for credit losses on loans was approximately $17.5 billion at quarter end, with a reserve-to-funded loans ratio of 2.67%, compared to $16.0 billion, or 2.44% of funded loans, at the end of the prior-year period. Total non-accrual loans decreased 15% from the prior-year period to $2.6 billion. Consumer non-accrual loans decreased 4% to $1.3 billion and corporate non-accrual loans decreased 24% to $1.3 billion.
Citigroup’s end-of-period loans were $661 billion at quarter end, up 1% versus the prior-year period, as growth in PBWM, reflecting increases in US Personal Banking, was largely offset by declines in ICG and Legacy Franchises.
Citigroup’s end-of-period deposits were approximately $1.3 trillion at quarter end, largely unchanged versus the prior-year period, as an increase in institutional certificates of deposit in Corporate / Other was offset by decreases in ICG, driven by Securities Services.
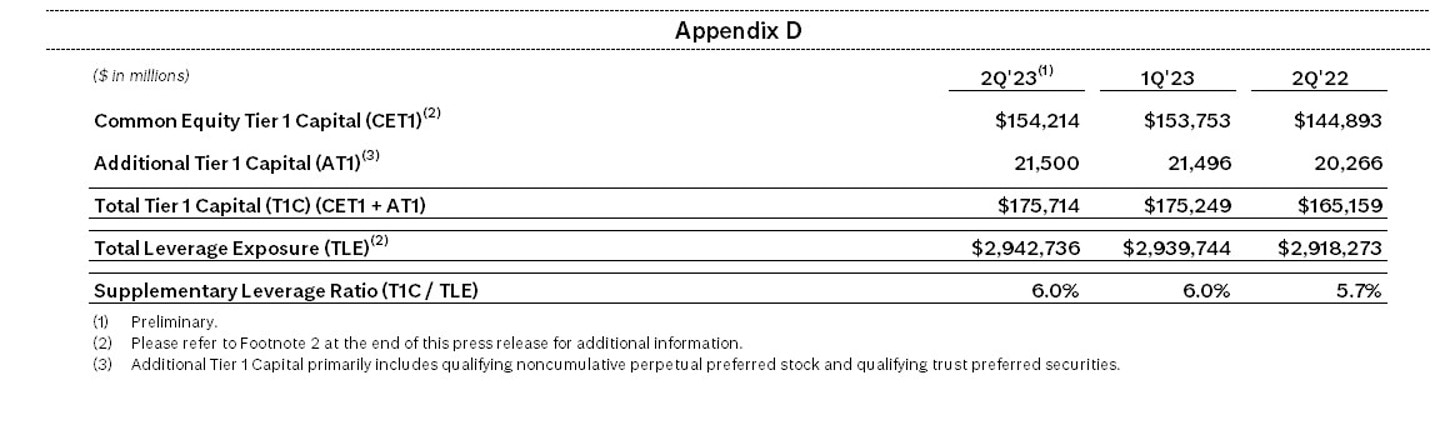
Citigroup’s book value per share of $97.87 and tangible book value per share of $85.34 at quarter end increased 5% and 6%, respectively, versus the prior-year period, largely driven by net income to common and common share repurchases, partially offset by payment of common dividends and adverse movements in the accumulated other comprehensive income (AOCI) component of equity. At quarter end, Citigroup’s CET1 capital ratio was 13.3% versus 13.4% in the prior quarter, as the impact of common dividends and share repurchases, as well as growth in risk-weighted assets, was partially offset by net income to common. Citigroup’s Supplementary Leverage ratio for the second quarter 2023 was 6.0% which was largely unchanged from the prior quarter. During the quarter, Citigroup returned a total of $2.0 billion to common shareholders in the form of dividends and repurchases.
Institutional Clients Group
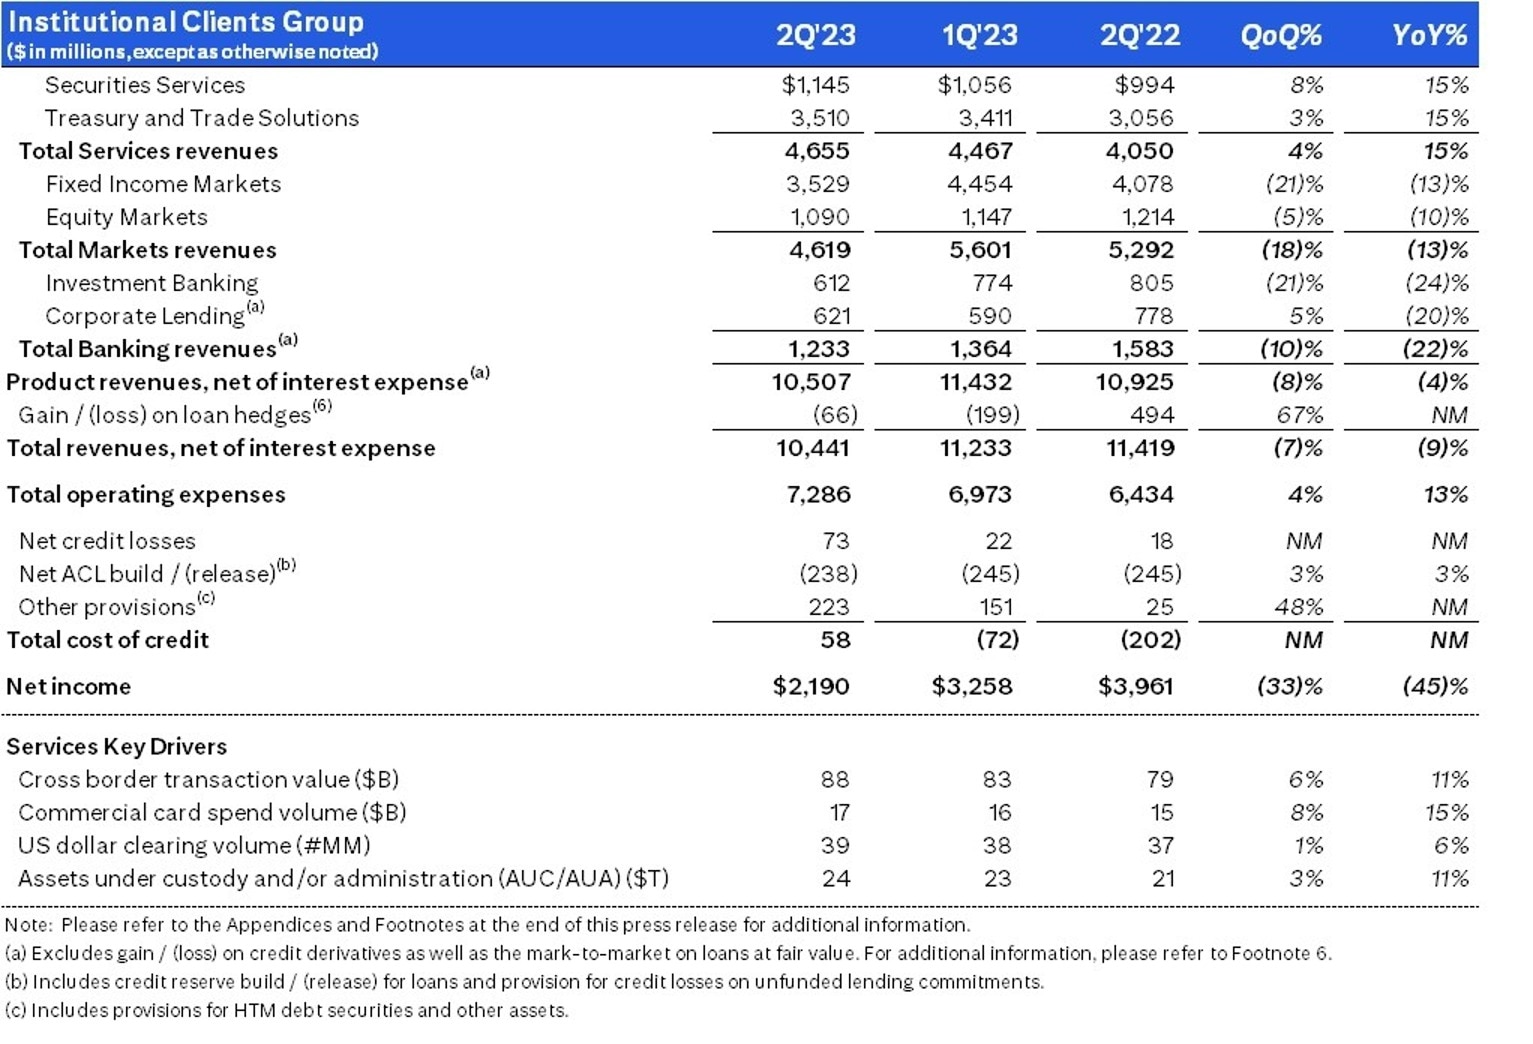
ICG revenues of $10.4 billion were down 9% (including gain/(loss) on loan hedges)6, as growth in Services was more than offset by a decline in Markets and Banking.
Services revenues of $4.7 billion increased 15%. TTS revenues of $3.5 billion increased 15%, driven by 18% growth in net interest income and 8% growth in non-interest revenue. Strong performance in TTS was driven by higher interest rates and non-interest revenue benefits from continued volume growth in underlying drivers, with double-digit growth in cross border transaction value and commercial card spend volume. Securities Services revenues of $1.1 billion increased 15%, as net interest income increased 62%, driven by higher interest rates across currencies.
Markets revenues of $4.6 billion decreased 13%, driven by both Fixed Income and Equities, relative to a strong quarter last year, coupled with low volatility this quarter. Fixed Income Markets revenues of $3.5 billion decreased 13%, as strength in the Rates franchise was more than offset by declines in Currencies and Commodities. Equity Markets revenues of $1.1 billion were down 10%, primarily reflecting a decline in Equity Derivatives.
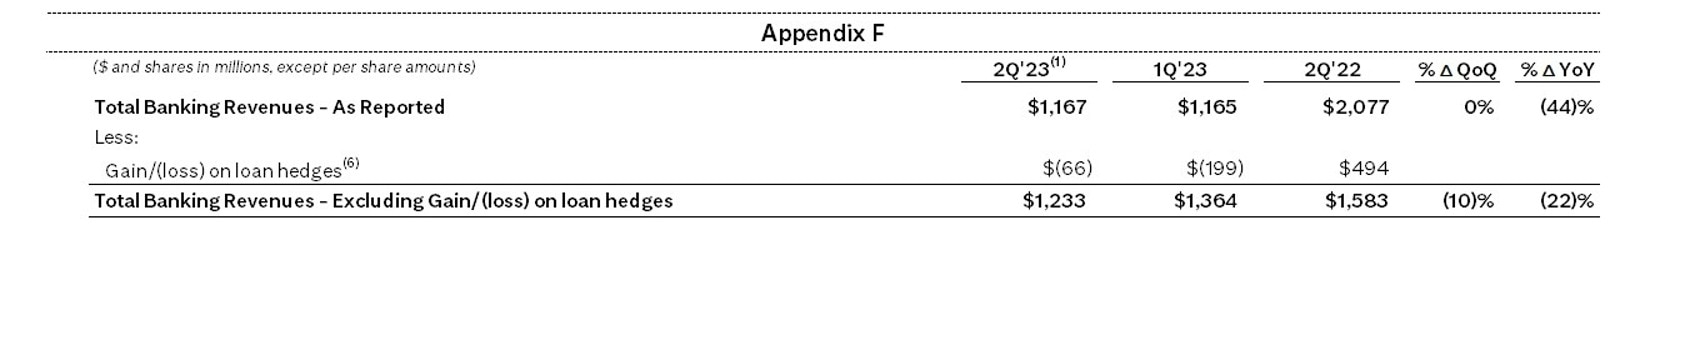
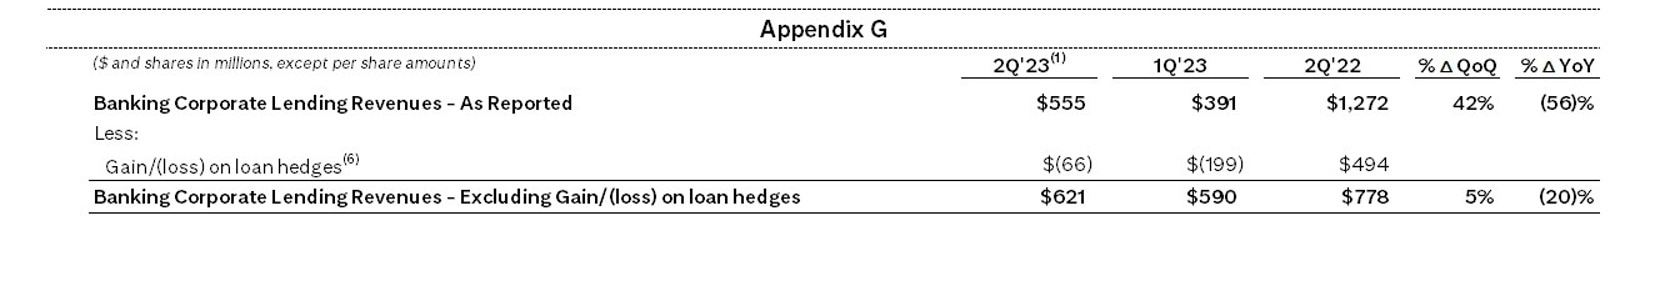
Banking revenues of $1.2 billion decreased 44%, including gain/(loss) on loan hedges in the current quarter and the prior-year period. Excluding gain/(loss) on loan hedges6, Banking revenues of $1.2 billion decreased 22%, driven by lower revenues in both Investment Banking and Corporate Lending. Investment Banking revenues of $612 million decreased 24%, as heightened macroeconomic uncertainty continued to impact client activity. Excluding gain/(loss) on loan hedges6, Corporate Lending revenues decreased 20% versus the prior-year period, driven by lower volumes.
ICG operating expenses of $7.3 billion increased 13%, driven by continued investments in TTS, risk and control investments, and severance in Markets and Investment Banking, partially offset by productivity savings.
ICG cost of credit of $58 million, compared to $(202) million in the prior-year period, included net credit losses of $73 million and other provisions of $223 million, partially offset by an ACL release for loans and unfunded commitments of $(238) million.
ICG net income of $2.2 billion decreased 45%, largely driven by the higher expenses, the lower revenues, as well as the higher cost of credit.
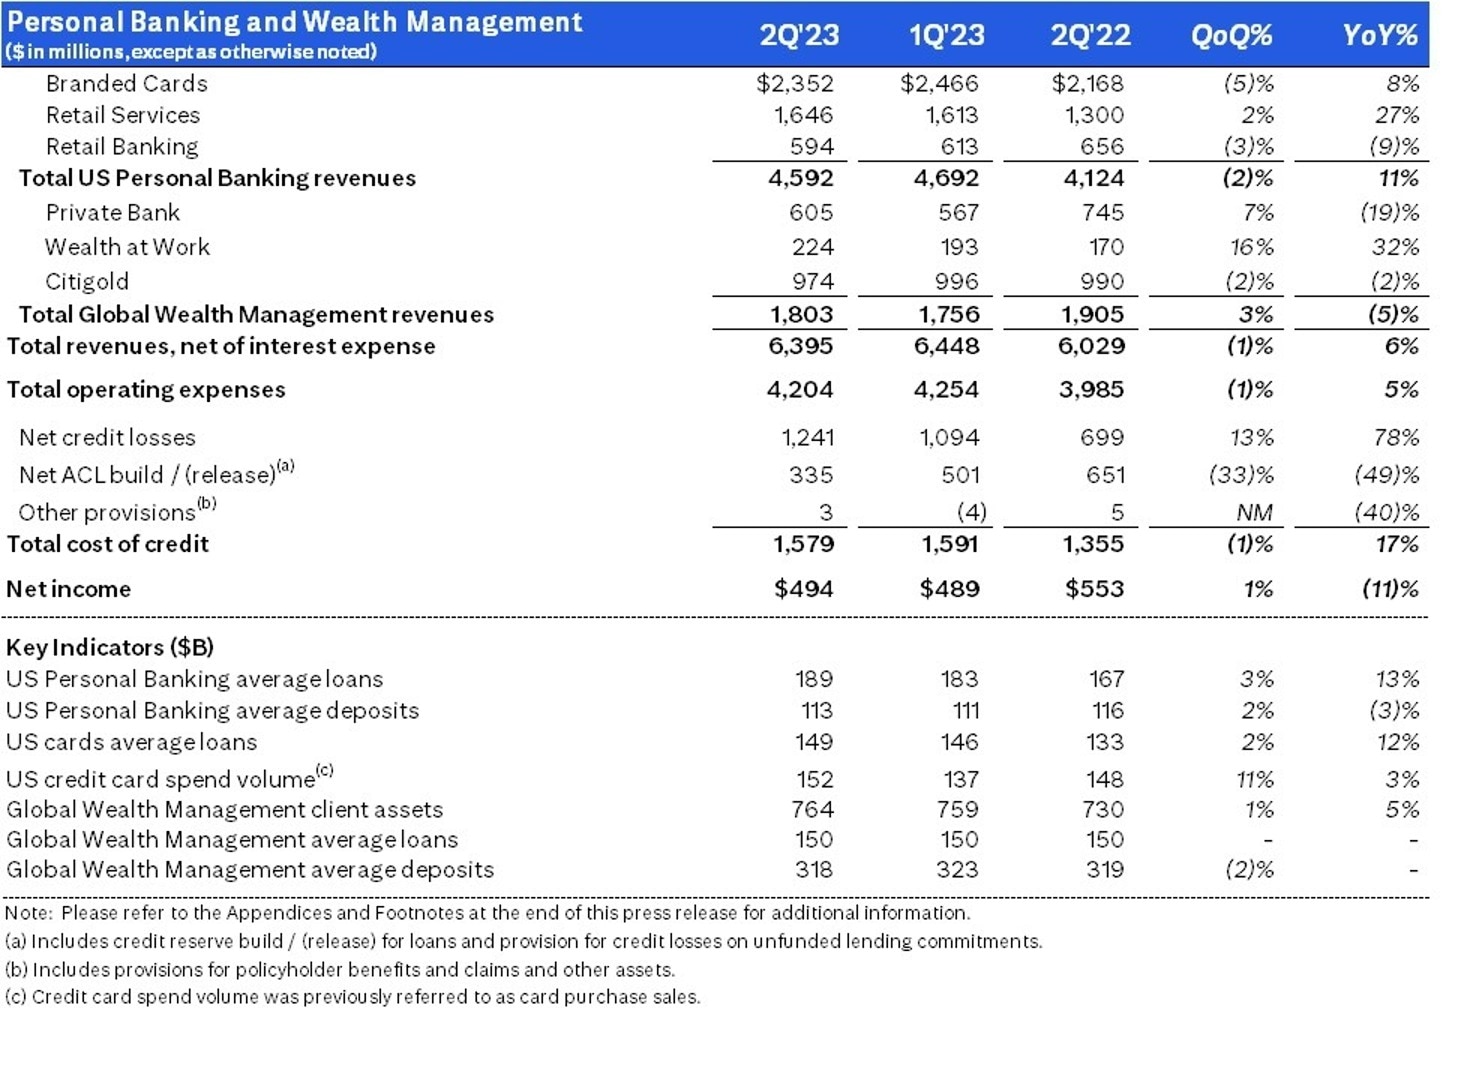
Personal Banking and Wealth Management
PBWM revenues of $6.4 billion increased 6%, as net interest income growth, driven by strong loan growth across US Personal Banking, was partially offset by a decline in non-interest revenue, driven by lower investment product revenues in Global Wealth Management.
US Personal Banking revenues of $4.6 billion increased 11%. Branded Cards revenues of $2.4 billion increased 8%, driven by the higher net interest income. Retail Services revenues of $1.6 billion increased 27%, primarily driven by the higher net interest income as well as lower partner payments. Retail Banking revenues of $594 million decreased 9%, primarily reflecting the transfer of relationships and the associated deposit balances to Global Wealth Management.
Global Wealth Management revenues of $1.8 billion decreased 5%, driven by continued investment fee headwinds and higher interest rates paid on deposits, partially offset by the benefits from the continued transfer of Retail Banking relationships.
PBWM operating expenses of $4.2 billion increased 5%, primarily driven by risk and control investments.
PBWM cost of credit was $1.6 billion, compared to $1.4 billion in the prior-year period. The increase was largely driven by net credit losses of $1.2 billion, which increased 78% from near historically low levels, reflecting ongoing normalization in Branded Cards and Retail Services. A net ACL build for loans and unfunded commitments of $335 million in the current quarter was primarily driven by growth in card balances.
PBWM net income of $494 million decreased 11%, driven by the higher cost of credit and the higher expenses, partially offset by the higher revenues.
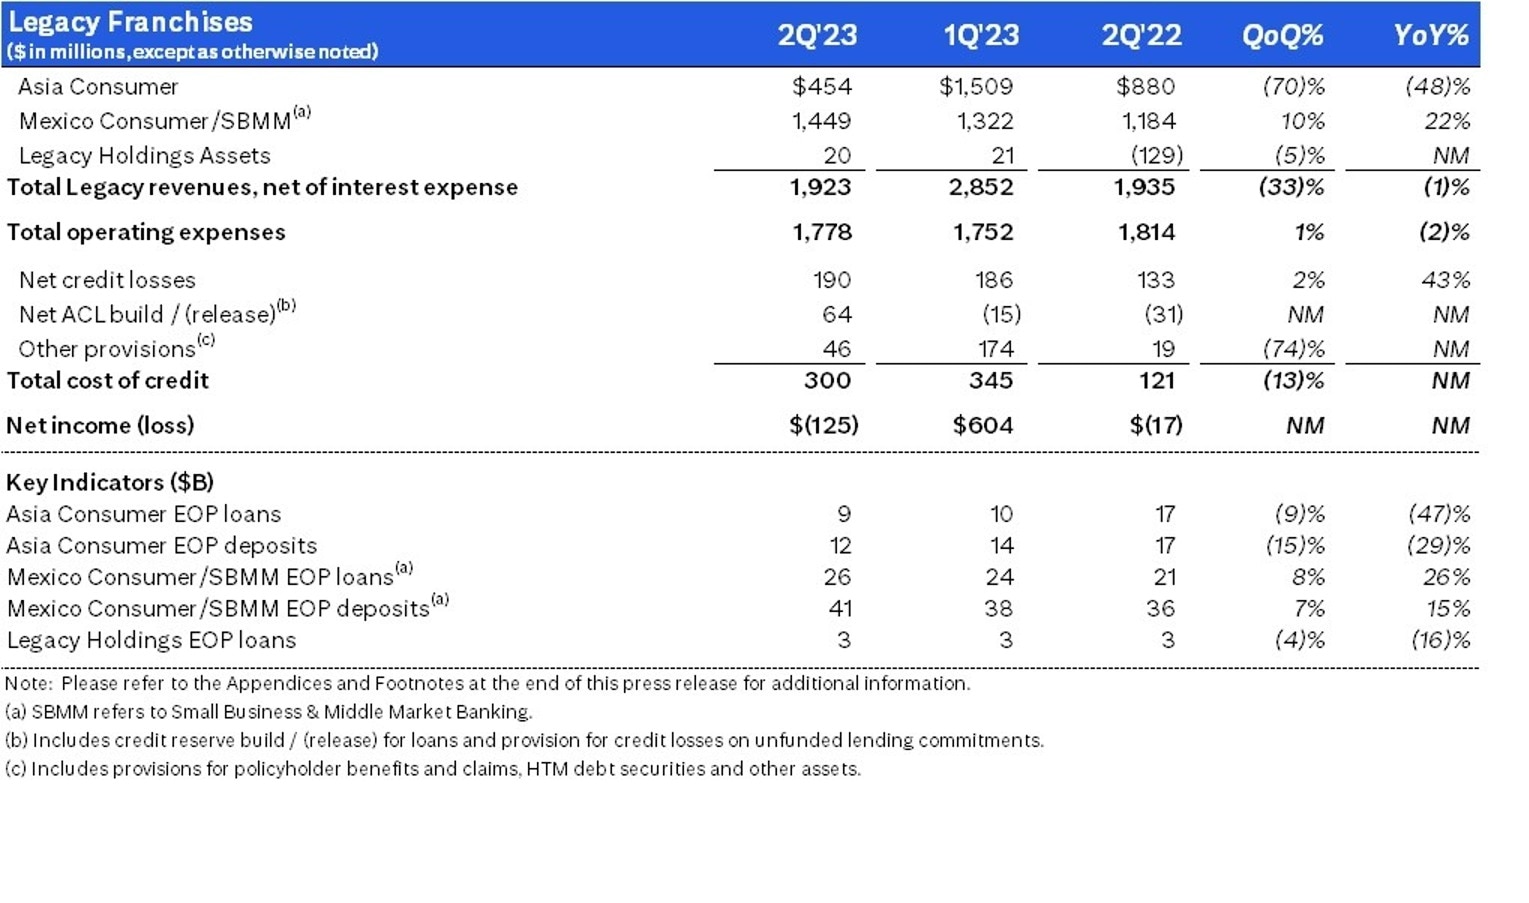
Legacy Franchises
Legacy Franchises revenues of $1.9 billion decreased 1%, as the benefit of higher rates and volumes in Mexico was more than offset by the reductions from exited markets and continued wind-downs.
Legacy Franchises expenses of $1.8 billion decreased 2%, primarily driven by the impact of exited markets and continued wind-downs.
Legacy Franchises cost of credit was $300 million, compared to $121 million in the prior-year period, and included net credit losses of $190 million and a net ACL build for loans and unfunded commitments of $64 million, reflecting volume growth in Mexico. Additionally, other provisions were $46 million in the quarter.
Legacy Franchises net loss was $(125) million, compared to a net loss of $(17) million in the prior-year period, primarily reflecting the higher cost of credit, partially offset by the lower expenses.
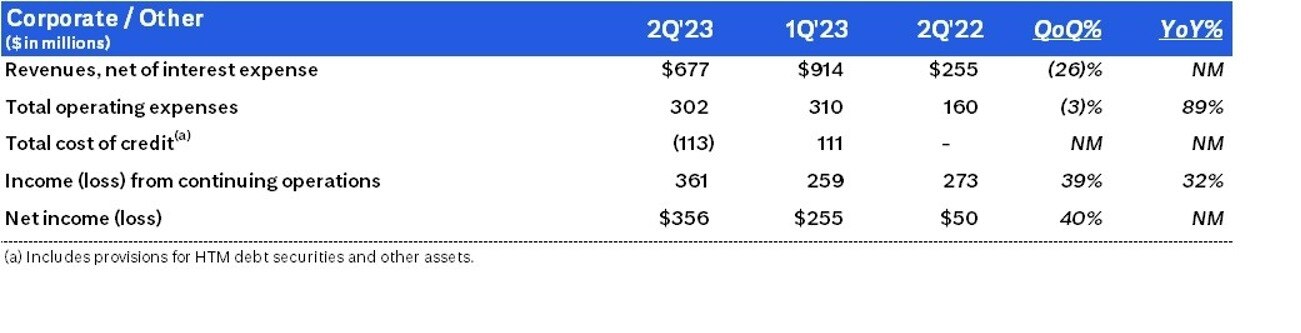
Corporate / Other
Corporate / Other revenues increased to $677 million from $255 million in the prior-year period, largely driven by higher net revenue from the investment portfolio, primarily due to higher interest rates.
Corporate / Other expenses of $302 million increased from $160 million in the prior-year period, primarily driven by inflation and severance.
Corporate / Other cost of credit of $(113) million was driven by a reserve release.
Corporate / Other income from continuing operations was $361 million, compared to $273 million in the prior-year period, largely reflecting the higher net revenue from the investment portfolio, as well as the reserve release, partially offset by the higher expenses.
Contacts: