Fourth Quarter and Full Year 2019 Results and Key Metrics
HIGHLIGHTS
- Net Income of $2.5 Billion ($1.05 per Share)
- Revenues of $20.7 Billion
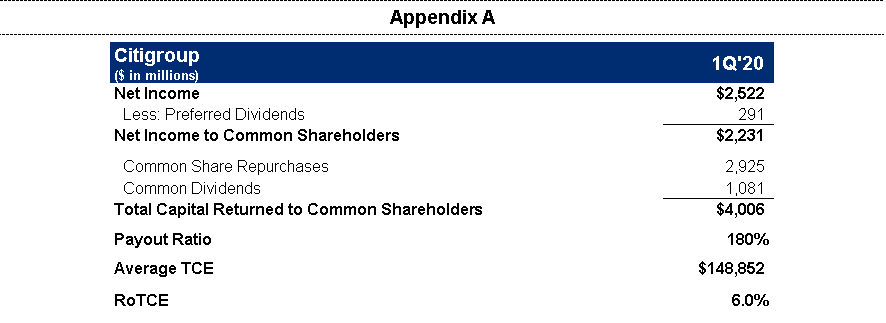
- Returned $4.0 Billion of Capital to Common Shareholders
- Repurchased 41 Million Common Sharessup>5
- Book Value per Share of $83.75
- Tangible Book Value per Share of $71.526
Read the full press release with tables and CEO commentary.
View the Financial Supplement (PDF)
View Financial Supplement (Excel)
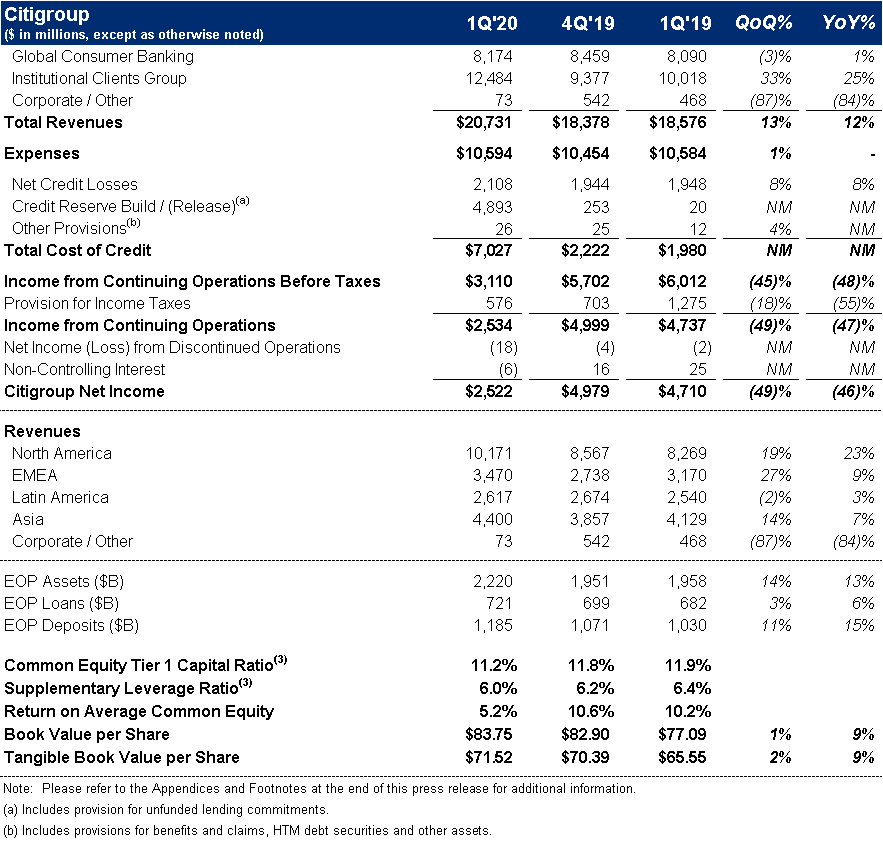
New York – Citigroup Inc. today reported net income for the first quarter 2020 of $2.5 billion, or $1.05 per diluted share, on revenues of $20.7 billion. This compared to net income of $4.7 billion, or $1.87 per diluted share, on revenues of $18.6 billion for the first quarter 2019.
Revenues increased 12% from the prior-year period, primarily reflecting higher revenues in Fixed Income Markets and Equity Markets, and the benefit of mark-to-market gains on loan hedges in the corporate lending portfolio, all in the Institutional Clients Group (ICG). Net income declined 46% from the prior-year period, driven by higher loan loss reserves, reflecting the impact of changes in Citi's economic outlook on estimated lifetime losses under the new Current Expected Credit Loss standard (CECL). Earnings per share of $1.05 decreased 44% from the prior-year period, as the decline in net income was partially offset by a 10% reduction in average diluted shares outstanding.
Percentage comparisons throughout this press release are calculated for the first quarter 2020 versus the first quarter 2019, unless otherwise specified.
Michael Corbat, Citi CEO, said, "Our earnings for the first quarter were significantly impacted by the COVID-19 pandemic. We managed our expenses with discipline and had good revenue performance as the economic shocks caused by the pandemic weren't felt until late in the quarter. However, the deteriorating economic outlook and the transition to the new Current Expected Credit Loss standard (CECL) caused us to build significant loan loss reserves.
"COVID-19 is a public health crisis with severe economic ramifi-cations. All of the work we have done in recent years has put us in a very strong position from a capital, liquidity and balance sheet pers-pective. While no one knows the severity or longevity of the virus' impact on the global economy, we have the resources we need to serve our clients without jeopard-izing our safety and soundness.
"I want to thank our 200,000 people around the world who have had to work differently but have brought their same dedication and pride to their jobs each and every day. They have supported our clients, our communities and each other and I could not be prouder of them," Mr. Corbat concluded.
Citigroup
Citigroup revenues of $20.7 billion in the first quarter 2020 increased 12%, primarily reflecting the higher revenues in Fixed Income and Equity Markets, as well as the benefit of mark-to-market gains on loan hedges in Corporate Lending.
Citigroup operating expenses of $10.6 billion in the first quarter 2020 were largely unchanged, as continued investments in the franchise, higher compensation and volume-related expenses were offset by productivity savings and the wind-down of legacy assets.
Citigroup cost of credit of $7.0 billion in the first quarter 2020 compared to $2.0 billion in the prior-year period, reflecting the loan loss reserve builds related to the impact of changes in Citi's economic outlook on estimated lifetime losses under the CECL standard.
Citigroup net income of $2.5 billion in the first quarter 2020 declined 46%, driven by the higher cost of credit, partially offset by the higher revenues and a lower effective tax rate. Citigroup's effective tax rate was 19% in the current quarter compared to 21% in the first quarter 2019, reflecting a small benefit associated with stock-based incentive compensation.
Citigroup's allowance for loan losses was $20.8 billion at quarter end, or 2.91% of total loans, compared to $12.3 billion, or 1.82% of total loans, at the end of the prior-year period. Total non-accrual assets grew 12% from the prior-year period to $4.2 billion. Consumer non-accrual loans declined 13% to $1.7 billion and corporate non-accrual loans grew 43% to $2.5 billion.
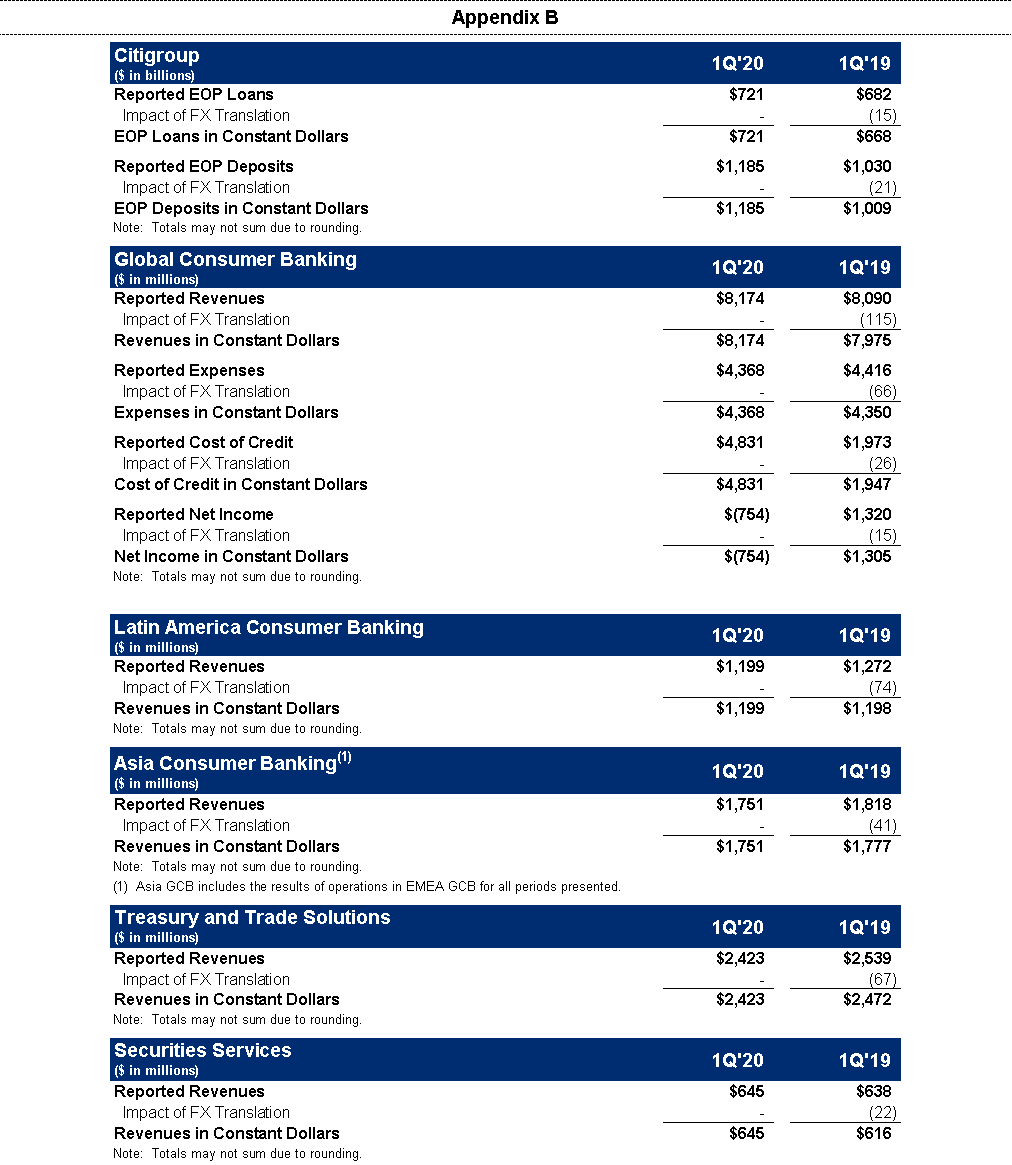
Citigroup's end-of-period loans were $721 billion as of quarter end, up 6% from the prior-year period. Excluding the impact of foreign exchange translation7, end-of-period loans grew 8%, driven by 9% aggregate growth in ICG and Global Consumer Banking (GCB), partially offset by the continued wind-down of legacy assets in Corporate / Other.
Citigroup's end-of-period deposits were $1.2 trillion as of quarter end, an increase of 15% from the prior-year period. In constant dollars, Citigroup's end-of-period deposits increased 17%, driven by 8% growth in GCB and 21% growth in ICG.
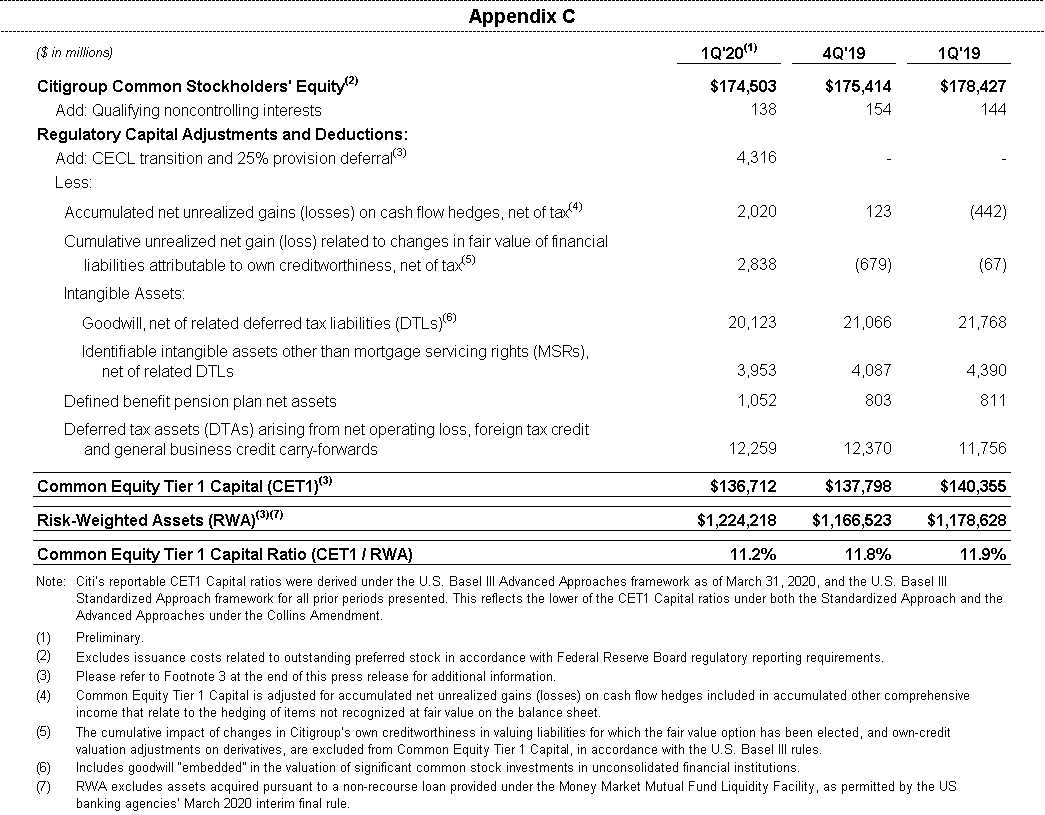
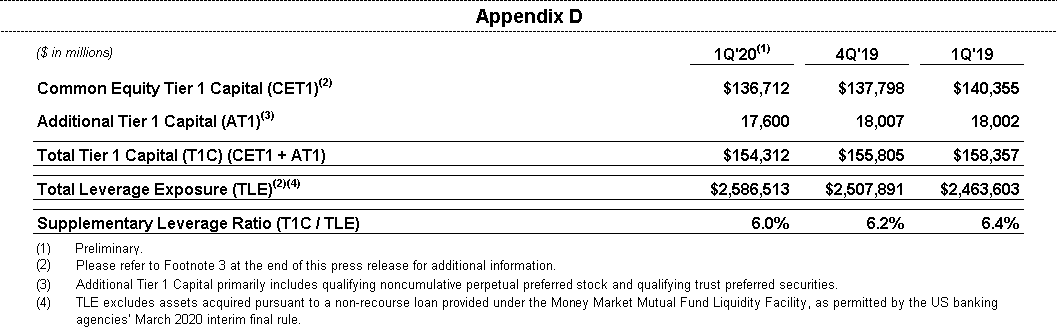
Citigroup's book value per share of $83.75 and tangible book value per share of $71.52 each increased 9% versus the prior-year period, driven by the net income and the reduced share count. At quarter end, Citigroup's CET1 Capital ratio was 11.2%, down from the prior quarter, primarily driven by growth in risk-weighted assets. Citigroup's SLR for the first quarter 2020 was 6.0%, a decrease from the prior quarter. During the quarter, Citigroup repurchased 41 million common shares and returned a total of $4.0 billion to common shareholders in the form of common share repurchases and dividends.
Global Consumer Banking
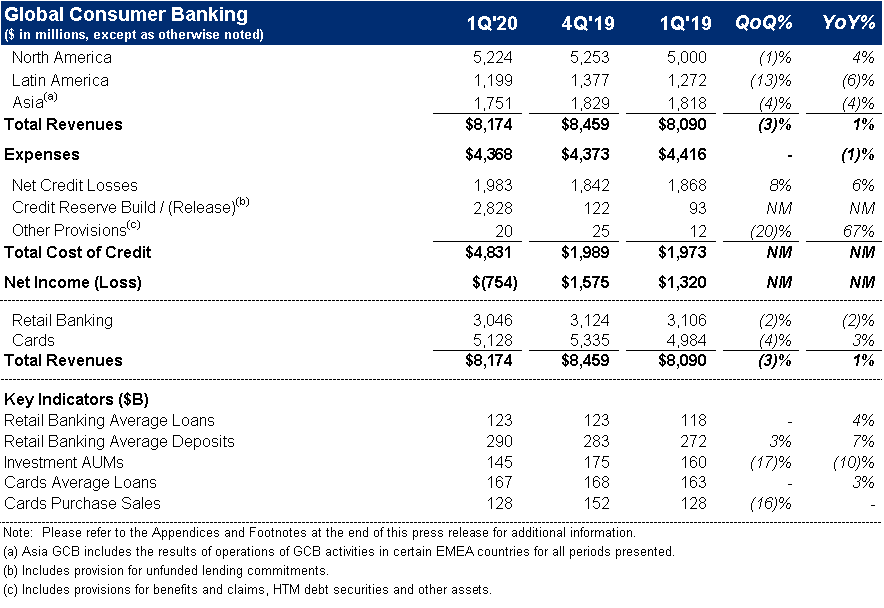
GCB revenues of $8.2 billion increased 1% on a reported basis and 2% in constant dollars, as growth in North America GCB was partially offset by lower revenues in Asia GCB, reflecting the early impact of the COVID-19 pandemic on customer behavior.
North America GCB revenues of $5.2 billion increased 4%. Citi-Branded Cards revenues of $2.3 billion increased 7%, reflecting volume growth as well as spread expansion. Retail Banking revenues of $1.1 billion were largely unchanged, as deposit growth and higher mortgage revenues were offset by lower deposit spreads. Citi Retail Services revenues of $1.7 billion increased 4%, reflecting a reduction in partner payments and higher average loans.
Latin America GCB revenues of $1.2 billion declined 6% on a reported basis and were largely unchanged in constant dollars. Excluding the impact of a residual gain in the prior-year period on the sale of an asset management business, revenues increased 3% in constant dollars, driven by deposit growth and improved spreads in cards.
Asia GCB revenues of $1.8 billion declined 4% on a reported basis and 1% in constant dollars as growth in investment and FX revenues was more than offset by lower revenues in cards, reflecting lower sales volumes due to COVID-19.
GCB operating expenses of $4.4 billion decreased 1% versus the prior year. In constant dollars, expenses were largely unchanged, as efficiency savings were offset by continued investments in the franchise and volume-driven growth.
GCB cost of credit of $4.8 billion increased significantly on a reported basis and in constant dollars. The increase reflects larger loan loss reserve builds related to the impact of changes in Citi's economic outlook on estimated lifetime losses under the CECL standard.
GCB net loss of $(0.8) billion compared to income of $1.3 billion in the prior-year period, in reported and constant dollars, driven by the higher cost of credit, partially offset by the higher revenues and the lower expenses.
Institutional Clients Group
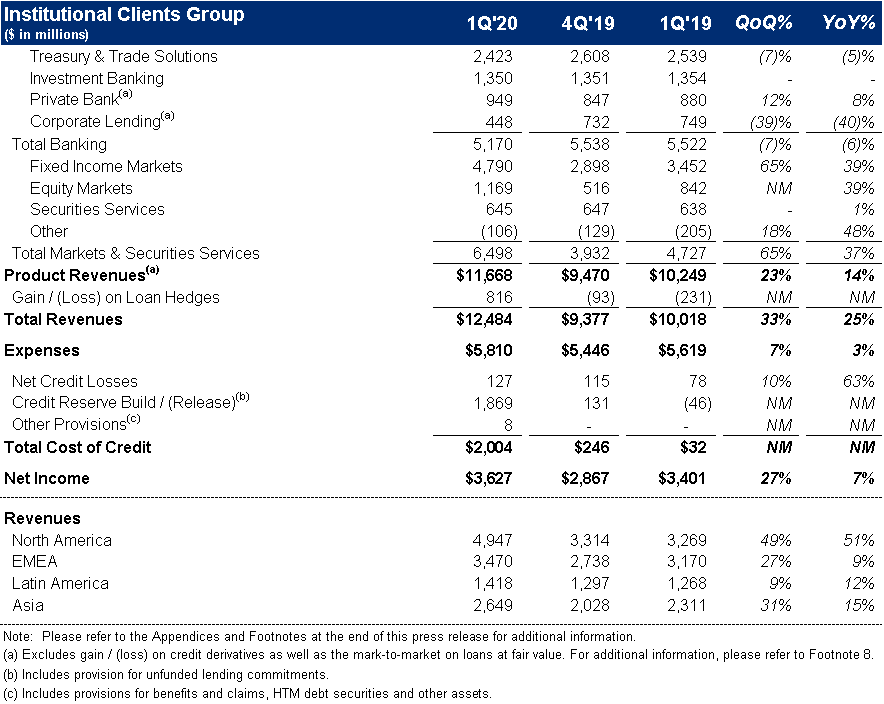
ICG revenues of $12.5 billion increased 25%, as strong performance in Fixed Income and Equity Markets, and mark-to-market gains on loan hedges, were partially offset by lower revenues in Corporate Lending and Treasury and Trade Solutions.
Banking revenues of $6.0 billion increased 13% versus the prior year (including gain / (loss) on loan hedges)8. Treasury and Trade Solutions revenues of $2.4 billion declined 5% on a reported basis and 2% in constant dollars, as strong client engagement and growth in deposits were more than offset by the impact of lower rates. Investment Banking revenues of $1.4 billion were largely unchanged, as growth in advisory and equity underwriting were offset by a decline in debt underwriting. Advisory revenues increased 2% to $386 million, equity underwriting revenues increased 5% to $180 million and debt underwriting revenues declined 2% to $784 million. Private Bank revenues of $949 million increased 8% (excluding gain / (loss) on loan hedges), driven by higher lending and deposit volumes, as well as increased capital markets activity partially offset by lower deposit spreads. Corporate Lending revenues of $448 million declined 40% (excluding gain / (loss) on loan hedges), primarily reflecting an adjustment to the residual value of a lease financing, as well as other marks on the portfolio.
Markets and Securities Services revenues of $6.5 billion increased 37%. Fixed Income Markets revenues of $4.8 billion increased 39%, reflecting strength in rates and currencies and commodities. Equity Markets revenues of $1.2 billion increased 39%, with strong performance in derivatives, including an increase in client activity, due to higher volatility. Securities Services revenues of $645 million increased 1% on a reported basis and 5% in constant dollars, reflecting higher client activity and deposit volumes partially offset by lower spreads.
ICG net income of $3.6 billion increased 7%, as the revenue growth was partially offset by higher cost of credit and expenses. ICG operating expenses increased 3% to $5.8 billion, as efficiency savings were more than offset by higher compensation costs, continued investments, and volume-driven growth. ICG cost of credit included net credit losses of $127 million, compared to $78 million in the prior-year period, and a net loan loss reserve build of $1.9 billion compared to a release of $46 million in the prior-year period, reflecting loan loss reserve builds related to the impact of changes in Citi's economic outlook on estimated lifetime losses under the CECL standard.

Corporate / Other
Corporate / Other revenues of $73 million declined 84%, reflecting the wind-down of legacy assets, the impact of lower rates and marks on legacy securities.
Corporate / Other expenses of $416 million declined 24%, driven by the wind-down of legacy assets, partially offset by higher infrastructure costs as well as incremental costs associated with COVID-19, including special compensation awarded to 75,000 employees most directly impacted by the pandemic.
Corporate / Other loss from continuing operations before taxes of $(535) million compared to $(56) million in the prior-year period driven by higher cost of credit, reflecting loan loss reserves on Citi's residual legacy portfolio under the CECL standard, and the lower revenues, partially offset by the decrease in expenses.
Citigroup will host a conference call today at 10:00 a.m. (ET). A live webcast of the presentation, as well as financial results and presentation materials, will be available at https://www.citigroup.com/global/investors. Dial-in numbers for the conference call are as follows: (866) 516-9582 in the U.S. and Canada; (973) 409-9210 outside of the U.S. and Canada. The conference code for both numbers is 3653669.
Additional financial, statistical and business-related information, as well as business and segment trends, is included in a Quarterly Financial Data Supplement. Both this earnings release and Citigroup's First Quarter 2020 Quarterly Financial Data Supplement are available on Citigroup's website at www.citigroup.com.
Citi
Contacts: