
Third Quarter 2023 Results and Key Metrics
HIGHLIGHTS
- RETURNED $1.5 BILLION IN THE FORM OF DIVIDENDS AND REPURCHASES
- PAYOUT RATIO OF 48%3
- BOOK VALUE PER SHARE OF $99.28
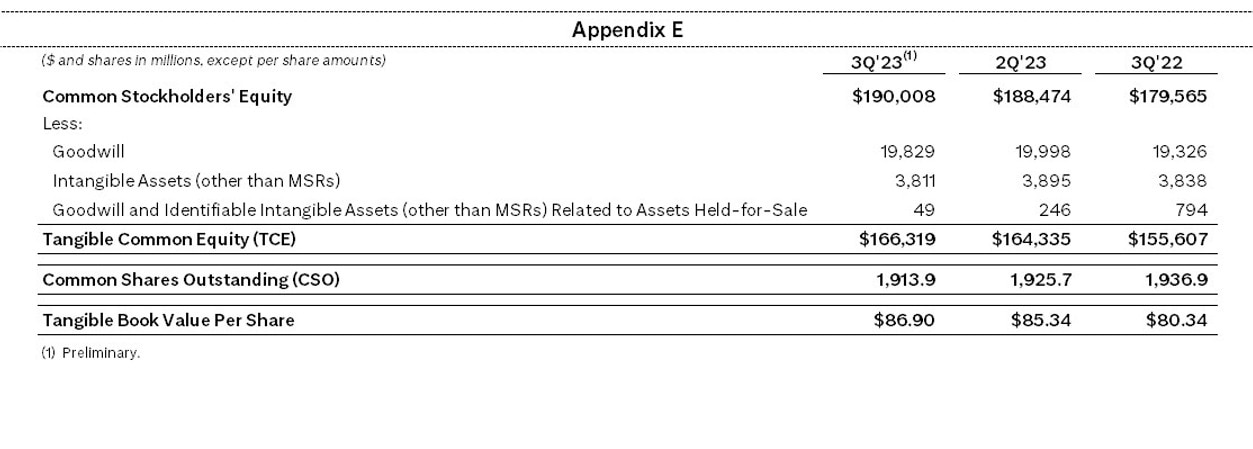
- TANGIBLE BOOK VALUE PER SHARE OF $86.904
Read the full press release with tables and CEO commentary
View the Financial Supplement (PDF)
View Financial Supplement (Excel)
New York, October 13, 2023 – Citigroup Inc. today reported net income for the third quarter 2023 of $3.5 billion, or $1.63 per diluted share, on revenues of $20.1 billion. This compares to net income of $3.5 billion, or $1.63 per diluted share, on revenues of $18.5 billion for the third quarter 2022.
Revenues increased 9% from the prior-year period, largely driven by strength across Services and Markets in Institutional Clients Group (ICG) and US Personal Banking within Personal Banking and Wealth Management (PBWM), as well as growth in Banking in ICG. This increase was partially offset by a revenue reduction from the closed exits and wind-downs within Legacy Franchises.
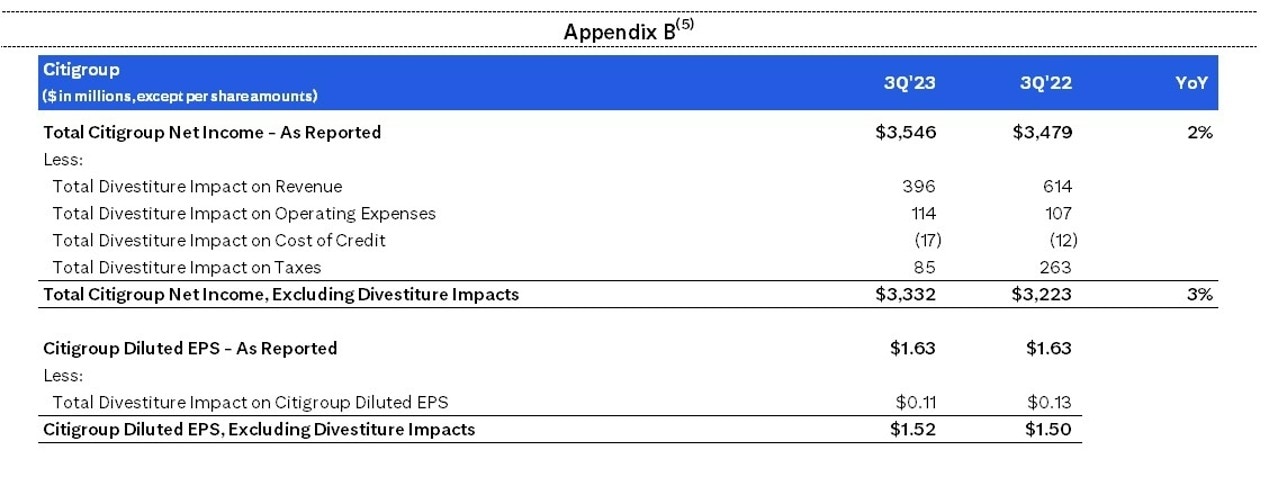
Third quarter results included divestiture-related impacts of $299 million5 in earnings before taxes ($214 million after-tax), primarily driven by a gain on the sale of the Taiwan consumer business, recorded in Legacy Franchises. Excluding these divestiture-related impacts, earnings per share was $1.525. This compares to divestiture-related impacts in the third quarter 2022 of $519 million5 in earnings before taxes ($256 million after-tax), also recorded in Legacy Franchises, and earnings per share of $1.50, excluding divestiture-related impacts5.
Net income of $3.5 billion increased 2% from the prior-year period. Excluding divestiture-related impacts5, net income increased 3%. The increase in net income was primarily driven by the higher revenue, partially offset by higher expenses and higher cost of credit.
Citi CEO Jane Fraser said, “Despite the headwinds, our five core, interconnected businesses each posted revenue growth resulting in overall growth of 9%. Services, our fastest growing business, grew by 13% with Treasury and Trade Solutions having its best quarter in a decade. Markets was up 10% driven by strength in Fixed Income. Banking activity played to our mix and grew 17%, bolstered by a rebound in debt issuance and some signs of life in the equity capital markets. U.S. Personal Banking also had double-digit revenue growth while a continued deceleration in spending indicates an increasingly cautious consumer. And Wealth revenues grew as the business continues to win new mandates and acquire new clients.
“Our CET1 ratio grew to 13.5% which is $14 billion above our current regulatory minimum after returning $1.5 billion to our shareholders through common dividends and share repurchases. Our discipline of growing operating deposits has enabled us to maintain a stable deposit base. Taken with our high-quality asset portfolio, strong reserve levels, ample liquidity and diversified earnings base, we are proving to our clients that we truly are a bank for all seasons.
“Last month we announced consequential changes that align our organizational structure with our strategy and changes how we run the bank. When completed, we will have a simpler firm that can operate faster, better serve our clients and unlock value for our shareholders,” Ms. Fraser concluded.
Percentage comparisons throughout this press release are calculated for the third quarter 2023 versus the third quarter 2022, unless otherwise specified.
Third Quarter Financial Results

Citigroup
Citigroup revenues of $20.1 billion in the third quarter 2023 increased 9%. The higher revenues reflected strength across Services, US Personal Banking and Markets, as well as growth in Banking, which was offset by the revenue reduction from the closed exits and wind-downs.
Citigroup operating expenses of $13.5 billion in the third quarter 2023 increased 6%, largely driven by investments in risk and controls, severance and the impact of inflation. The expense increase was partially offset by productivity savings and expense reductions from the closed exits and wind-downs.
Citigroup cost of credit was approximately $1.8 billion in the third quarter 2023, compared to $1.4 billion in the prior-year period, primarily driven by the continued normalization in net credit losses and volume growth in cards in PBWM. A net build in the allowance for credit losses (ACL) for loans and unfunded commitments of $125 million was primarily driven by Branded Cards and Retail Services, largely related to growth in card balances.
Citigroup net income of $3.5 billion in the third quarter 2023 increased 2% from the prior-year period, primarily driven by the higher revenues, partially offset by the higher expenses and the higher cost of credit. Citigroup’s effective tax rate increased to approximately 25% in the current quarter versus 20% in the third quarter 2022, primarily driven by a different geographic mix of pre-tax earnings in the current quarter.
Citigroup’s total allowance for credit losses on loans was approximately $17.6 billion at quarter end, compared to $16.3 billion at the end of the prior-year period, with a reserve-to-funded loans ratio of 2.68%, compared to 2.54% at the end of the prior-year period. Total non-accrual loans increased 14% from the prior-year period to $3.3 billion. Corporate non-accrual loans increased 33% to $2.0 billion. Consumer non-accrual loans decreased (7)% to $1.3 billion.
Citigroup’s end-of-period loans were $666 billion at quarter end, up 3% versus the prior-year period, largely reflecting growth in US Personal Banking.
Citigroup’s end-of-period deposits were approximately $1.3 trillion at quarter end, down (3)% versus the prior-year period. The decline in deposits was largely due to a reduction in Services, reflecting quantitative tightening, a shift of deposits to higher-yielding investments in Global Wealth Management and a reduction of institutional certificates of deposit in Corporate/Other.
Citigroup’s book value per share of $99.28 and tangible book value per share of $86.90 at quarter end increased 7% and 8%, respectively, versus the prior-year period. The increases were largely driven by net income to common, common share repurchases, and beneficial movements in the accumulated other comprehensive income (AOCI) component of equity, partially offset by payment of common dividends. At quarter end, Citigroup’s CET1 Capital ratio was 13.5% versus 13.4% in the prior quarter, as net income to common, a benefit from the Taiwan consumer exit and a lower deferred tax assets deduction were partially offset by common dividends and share repurchases. Citigroup’s Supplementary Leverage ratio for the third quarter 2023 was 6.0%, which was largely unchanged from the prior quarter. During the quarter, Citigroup returned a total of $1.5 billion to common shareholders in the form of dividends and repurchases.

Institutional Clients Group
ICG revenues of $10.6 billion were up 12% (including gain/(loss) on loan hedges6), driven by growth across Services, Markets and Banking, partially offset by an approximately $180 million net impact from a currency devaluation in Argentina on Citi’s net investment in the country.
Services revenues of $4.7 billion increased 13%. TTS revenues of $3.6 billion increased 12%, driven by 17% growth in net interest income, as well as 1% growth in non-interest revenue. The increase in net interest income was primarily driven by higher interest rates and deposit volume growth. The increase in non-interest revenue was driven by continued growth in underlying drivers, largely offset by the impact from the currency devaluation in Argentina on our net investment in the country. Securities Services revenues of $1.1 billion increased 16%, driven by higher net interest income across currencies.
Markets revenues of $4.5 billion increased 10%, driven by Fixed Income. Fixed Income revenues of $3.6 billion increased 14%, largely driven by strength in rates and currencies. Equity revenues of $918 million were down (3)%, driven by a decline in equity derivatives, partially offset by growth in cash and prime.
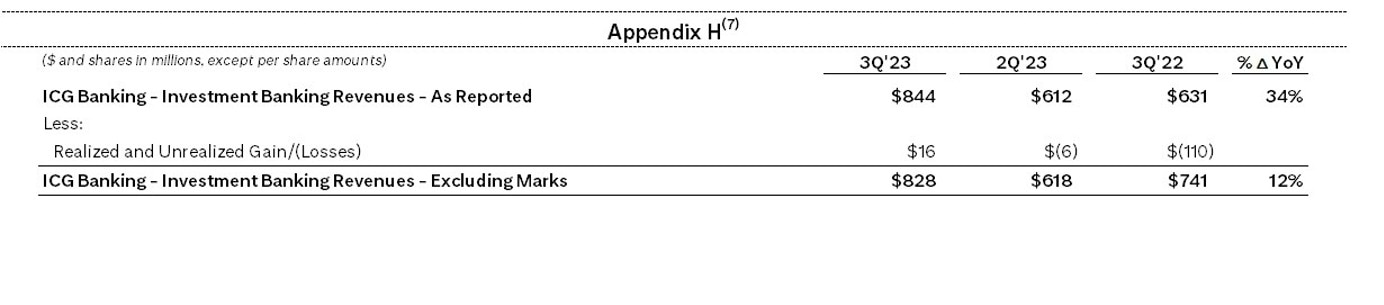
Banking revenues of $1.4 billion increased 18%, including gain/(loss) on loan hedges in the current quarter and the prior-year period. Excluding gain/(loss) on loan hedges6, Banking revenues of $1.5 billion increased 17%, driven by higher revenues in Investment Banking. Investment Banking revenues of $844 million increased 34%, reflecting increased client activity in debt underwriting and the absence of certain realized and unrealized gain/(losses). Excluding the impact of these marks7, Investment Banking revenues increased 12% versus the prior-year period. Excluding gain/(loss) on loan hedges6, Corporate Lending revenues were up 1% versus the prior-year period.
ICG operating expenses of $7.2 billion increased 10%, primarily driven by continued investments in risk and controls, volume related expenses, partially offset by productivity savings.
ICG cost of credit of $196 million, compared to $86 million in the prior-year period, included net credit losses of $51 million, an ACL build for loans and unfunded commitments of $61 million and other provisions of $84 million.
ICG net income of $2.4 billion increased 12%, driven by the higher revenues, partially offset by the higher expenses and the higher cost of credit.

Personal Banking and Wealth Management
PBWM revenues of $6.8 billion increased 10%, driven by growth in net interest income, reflecting strong loan growth in US Personal Banking, as well as higher non-interest revenue, primarily due to lower partner payments in Retail Services and higher investment product revenues in Global Wealth Management.
US Personal Banking revenues of $4.9 billion increased 13%. Branded Cards revenues of $2.5 billion increased 12%, primarily driven by the higher net interest income, reflecting the strong loan growth. Retail Services revenues of $1.7 billion increased 21%, primarily driven by the higher net interest income from loan growth, as well as the lower partner payments. Retail Banking revenues of $624 million decreased (3)%, largely driven by the transfer of relationships and the associated deposits to Global Wealth Management, partially offset by the strength in deposit spreads.
Global Wealth Management revenues of $1.9 billion increased 2%, largely driven by the transfer of relationships from Retail Banking, higher investment fees and higher lending revenue.
PBWM operating expenses of $4.3 billion increased 5%, largely driven by investments in risk and controls and severance, partially offset by productivity savings.
PBWM cost of credit was $1.5 billion, compared to $1.1 billion in the prior-year period. The increase was largely driven by higher net credit losses of $1.4 billion, reflecting continued normalization in Branded Cards and Retail Services.
PBWM net income of $803 million increased 1%, driven by the higher revenue, largely offset by the higher cost of credit and the higher expenses.
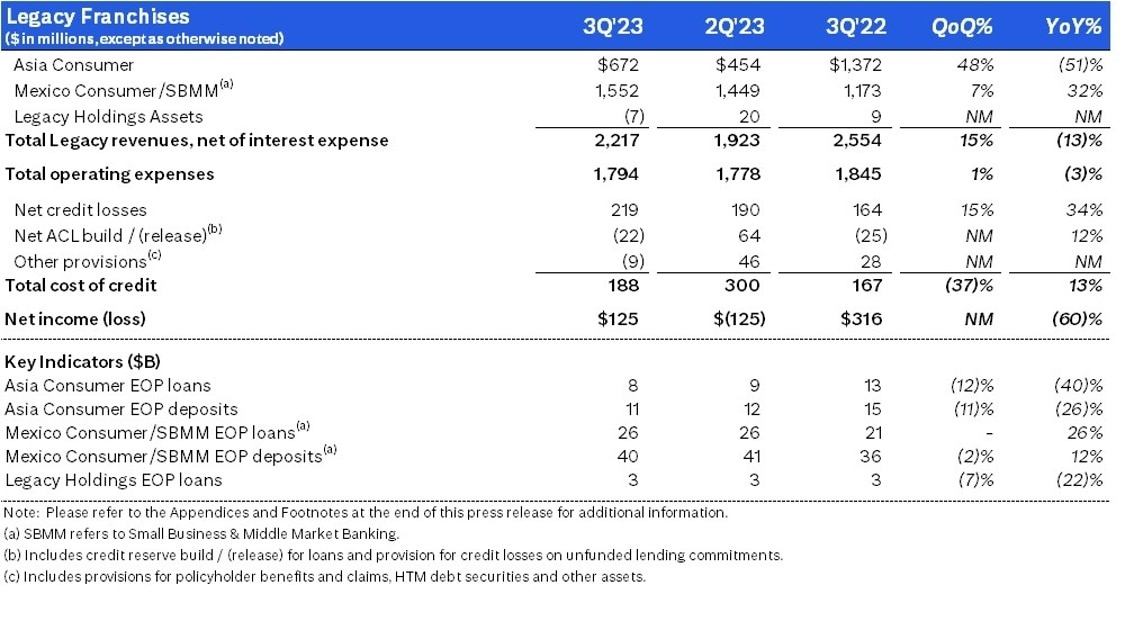
Legacy Franchises
Legacy Franchises revenues of $2.2 billion decreased (13)%, largely driven by the difference in one-time gain on sale impacts in the Asia consumer businesses and reductions from closed exits and wind-downs, partially offset by higher revenues in Mexico, reflecting Mexico peso appreciation, higher interest rates and volume growth.
Legacy Franchises expenses of $1.8 billion decreased (3)%, primarily driven by the closed exits and wind-downs, partially offset by separation costs in Mexico and the Mexican peso appreciation.
Legacy Franchises cost of credit was $188 million, compared to $167 million in the prior-year period, reflecting net credit losses of $219 million, partially offset by a net ACL release for loans and unfunded commitments.
Legacy Franchises net income was $125 million, compared to $316 million in the prior-year period, primarily reflecting the lower revenues and the higher cost of credit, partially offset by the lower expenses.

Corporate / Other
Corporate / Other revenues increased to $500 million from $299 million in the prior-year period, largely driven by the absence of the mark-to-market impacts on certain derivative transactions in the prior-year period.
Corporate / Other expenses of $237 million decreased from $286 million in the prior-year period, primarily driven by lower consulting fees.
Corporate / Other income from continuing operations was $190 million, compared to $221 million in the prior-year period, reflecting the higher net revenue, lower expenses and the absence of certain income tax benefit items related to non-U.S. operations in the prior-year period.
Citigroup will host a conference call today at 11:00 AM (ET). A live webcast of the presentation, as well as financial results and presentation materials, will be available at https://www.citigroup.com/global/investors. The live webcast of the presentation can also be accessed at https://www.veracast.com/webcasts/citigroup/webinars/Citi3Q2023.cfm.
Additional financial, statistical and business-related information, as well as business and segment trends, is included in a Quarterly Financial Data Supplement. Both this earnings release and Citigroup’s Third Quarter 2023 Quarterly Financial Data Supplement are available on Citigroup’s website at www.citigroup.com.
Citi is a preeminent banking partner for institutions with cross-border needs, a global leader in wealth management and a valued personal bank in its home market of the United States. Citi does business in nearly 160 countries and jurisdictions, providing corporations, governments, investors, institutions and individuals with a broad range of financial products and services.
Additional information may be found at www.citigroup.com | Twitter: @Citi | YouTube: www.youtube.com/citi | Blog: http://blog.citigroup.com | Facebook: www.facebook.com/citi | LinkedIn: www.linkedin.com/company/citi
Certain statements in this release are “forward-looking statements” within the meaning of the Private Securities Litigation Reform Act of 1995. These statements are based on management’s current expectations and are subject to uncertainty and changes in circumstances. These statements are not guarantees of future results or occurrences. Actual results and capital and other financial condition may differ materially from those included in these statements due to a variety of factors. These factors include, among others: Citi’s ability to achieve its objectives, including expense savings, from its transformation and strategic and other initiatives, which include the divestiture of Citi’s consumer, small business and middle-market operations in Mexico and other exits and wind-downs, all of which involve significant execution uncertainty and complexity and will result in continued higher expenses and may result in certain losses or other negative financial or strategic impacts; a potential U.S. federal government shutdown and the resulting impacts; continued elevated interest rates and the impacts on macroeconomic conditions, customer and client behavior, as well as Citi’s funding costs; potential recessions in the U.S., Europe and other countries; revisions to the Basel III rules, including the recently issued notice of proposed rulemaking, known as the Basel III Endgame, related to regulatory capital requirements; continued elevated levels of inflation and its impacts; potential increased regulatory requirements and costs, such as the FDIC’s recently issued notice of proposed rulemaking for a special assessment to recover the uninsured deposit losses from recent bank failures; the various uncertainties and impacts related to or resulting from Russia’s war in Ukraine; and the precautionary statements included in this release. These factors also consist of those contained in Citigroup’s filings with the U.S. Securities Exchange and Commission, including without limitation the “Risk Factors” section of Citigroup’s 2022 Form 10-K. Any forward-looking statements made by or on behalf of Citigroup speak only as to the date they are made, and Citi does not undertake to update forward-looking statements to reflect the impact of circumstances or events that arise after the date the forward-looking statements were made.
Contacts:
Investors: Jennifer Landis (212) 559-2718
Press: Danielle Romero-Apsilos (212) 816-2264
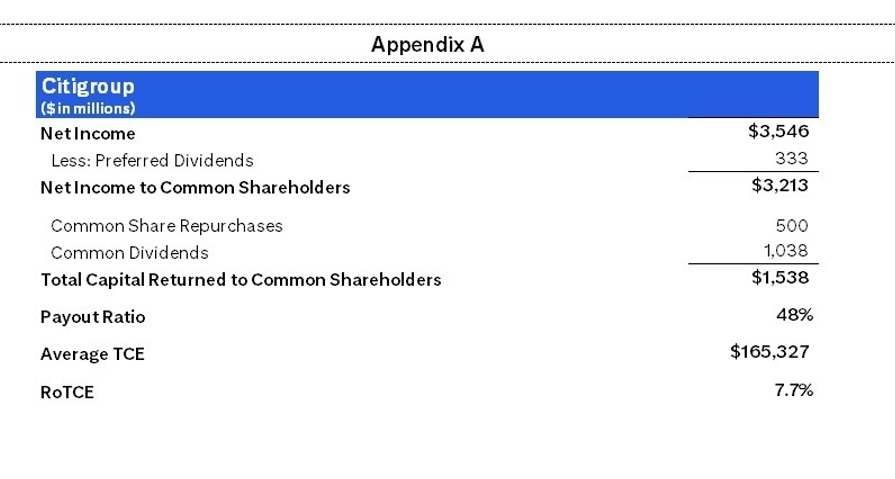


(1) Preliminary. Citigroup’s return on average tangible common equity (RoTCE) is a non-GAAP financial measure. RoTCE represents annualized net income available to common shareholders as a percentage of average tangible common equity (TCE). For the components of the calculation, see Appendix A. See Appendix E for a reconciliation of common equity to tangible common equity.
(2) Ratios as of September 30, 2023 are preliminary. Citigroup’s Common Equity Tier 1 (CET1) Capital ratio and Supplementary Leverage ratio (SLR) reflect certain deferrals based on the modified regulatory capital transition provision related to the Current Expected Credit Losses (CECL) standard. Excluding these deferrals, Citigroup’s CET1 Capital ratio and SLR as of September 30, 2023 would be 13.4% and 6.0%, respectively, on a fully reflected
basis. For additional information, see “Capital Resources—Regulatory Capital Treatment—Modified Transition of the Current Expected Credit Losses Methodology” in Citigroup’s 2022 Annual Report on Form 10-K. Certain prior period amounts have been revised to conform with enhancements made in the current period.
For the composition of Citigroup’s CET1 Capital and ratio, see Appendix C. For the composition of Citigroup’s SLR, see Appendix D.
(3) Citigroup’s payout ratio is the sum of common dividends and common share repurchases divided by net income available to common shareholders. For the components of the calculation, see Appendix A.
(4) Citigroup’s tangible book value per share is a non-GAAP financial measure. See Appendix E for a reconciliation of common equity to tangible common equity and resulting calculation of tangible book value per share.
(5) Third quarter 2023 results included divestiture-related impacts of approximately $299 million in earnings before taxes (approximately $214 million after-tax), recorded in Legacy Franchises, which primarily consisted of (i) a $403 million gain on sale of the Taiwan consumer business, recorded in Other revenue; (ii) $114 million of aggregate divestiture-related costs primarily related to Mexico and severance costs in Asia exit markets, recorded in Operating expenses; (iii) a $17 million benefit of divestiture-related credit costs; and (iv) related taxes of $85 million.
Third quarter 2022 results included divestiture-related impacts of $519 million in earnings before taxes ($256 million after-tax), recorded in Legacy Franchises, which primarily consisted of (i) a $616 million gain on sale of the Philippines consumer business, recorded in Other revenue and (ii) $107 million of aggregate divestiture-related costs primarily related to the gross receipt tax against the Philippines consumer business sale and severance costs in Asia exit markets, recorded in Operating expenses; (iii) a $12 million benefit of divestiture-related credit costs; and (iv) related taxes of $263 million.
Results of operations excluding these divestiture-related impacts are non-GAAP financial measures. For a reconciliation to reported results, please refer to Appendix B.
(6) Credit derivatives are used to economically hedge a portion of the Corporate Lending portfolio that includes both accrual loans and loans at fair value. Gain / (loss) on loan hedges includes the mark-to-market on the credit derivatives and the mark-to-market on the loans in the portfolio that are at fair value. In the third quarter 2023, gain / (loss) on loan hedges included $(47) million related to Corporate Lending, compared to $(56) million in the prior-year period. The fixed premium costs of these hedges are netted against the Corporate Lending revenues to reflect the cost of credit protection. Citigroup’s results of operations excluding the impact of gain / (loss) on loan hedges are non-GAAP financial measures. For a reconciliation to reported results, please refer to Appendices F and G.
(7) Investment Banking revenues excluding marks represents reported Investment Banking revenues in each period, excluding the impact of certain realized and unrealized gain/(losses) primarily related to loan commitments. Citigroup’s results of operations excluding the marks are non-GAAP financial measures. For a reconciliation to reported results, please refer to Appendix H.