
A recent report by Citi Research’s Satish Sivakumar looks at how freight rates are likely to be impacted by demand dynamics, homing in on some of the key leading indicators around container demand, including inflation.
Container shipping industry volumes and rates are categorized under three categories.
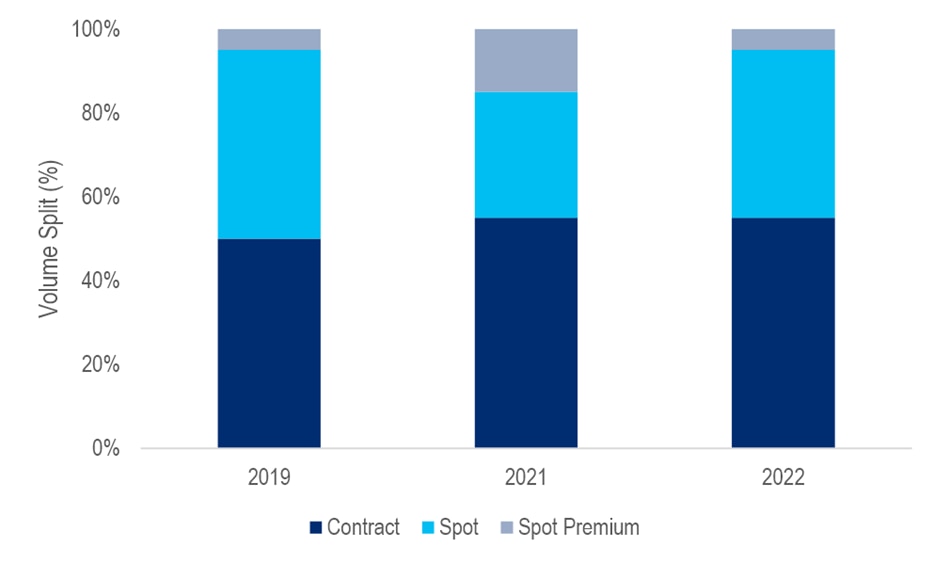
1. Contract Rates
2. Spot Rates
3. Spot Premium
The following chart shows volume splits for each of those categories over time.
Container Shipping Volume Split
© 2022 Citigroup Inc. No redistribution without Citigroup’s written permission.
Source: Citi Research
Liners with high exposure to contract rates have benefitted from higher rates in 2022. These rates have almost doubled over the course of the year. The majority of annual contract rates are negotiated in two main windows:
- Asia to Europe contract rates: Negotiated in November to December and effective from January.
- Trans-pacific contract rates: Negotiated in March to April and effective from May.
Meanwhile, spot rates account for c.40% of volumes today. The spot rates have seen a decline of c.-20% since April, despite an increase in congestion.
Heading into 2023, Citi analysts see the key drivers of merchandise demand as:
US New Home Sales
Analysts see US housing sales as a lead indicator for US container imports. They compare Port of LA container throughput and US new home sales and the analysis shows that container import starts to see a deceleration around 10-12months after the slow-down in new home sales.
Impact of Inflation on Consumption
Rising energy prices (cost-push) during 2007-2008 and 2011-2013 had some follow-on negative effects on East-West container demand growth. Other less volatile inflationary periods tend to see strong demand growth leading to inflationary pressures, i.e., demand-pull.

© 2022 Citigroup Inc. No redistribution without Citigroup’s written permmision
Source: Citi Research, Bloomberg
Freight Rates During Previous Down-Turns
In the full report, Citi analysts look at three major downturns between 1995 and 2008. East West freight rates decreased by c.-20% during the Asian crisis, c-30% during the Dotcom bubble and c-66% during the global financial crisis. In the first two crises, rates saw a V-shaped recovery compared to the financial crisis, with normalization of freight rates for the latter taking close to three years. This can be explained by the high level of orderbook in 2008 at c.60% compared to c.30% during the Asian crisis and the Dotcom bubble
For more information on this subject, please see report
Citi Global Insights (CGI) is Citi’s premier non-independent thought leadership curation. It is not investment research; however, it may contain thematic content previously expressed in an Independent Research report. For the full CGI disclosure, click here.
