

Citi analysts look at the pros and cons of four valuation approaches – production cost, stock to flow, user adoption, and macro factors.
Designed for the generalist investor as well as specialists, the Citi report is an attempt to bring balance and analytical rigor to a debate often more associated with hyperbole and linear projections.
Method 1: Cost of Production
The first technique is to analyze prices relative to the cost of production. The logic is that prices can only fall so far below costs, as otherwise production is reduced.
When bitcoin prices fall, miners are likely to leave the system, and the bitcoin algorithm then reduces mining difficulty in response, making mining activity cheaper. Thus the cost of production is impacted by the price of bitcoin, which makes this valuation approach less compelling. However, at low prices miners are less incentivized to sell their coins, perhaps altering the supply/demand dynamics at the margin. Commodities deal with similar forces. When the price of oil falls significantly, the cost of drilling tends to get cheaper, as demand for rigs decreases. The cost curve for commodities therefore also gets impacted by the commodity price, suggesting that the production cost model may be used for bitcoin too.
Assuming constant energy costs results in lower boundary. The cost of production is estimated as total energy consumed from mining bitcoin divided by total bitcoins mined per month. For this calculation, one commonly used model assumes a constant $0.05/kwh as the average energy price. This is likely a low estimate, especially as energy prices have broadly been rising, and electricity prices in particular are extremely volatile. This approach may be useful from time to time, as it can flag when bitcoin is trading in line with estimated minimum production costs.
A more realistic energy cost has a more relevant relationship with bitcoin. The Citi analysts also use a more complicated estimate for energy costs, where average mining costs per day are a function of the average electricity price in the ten largest bitcoin mining countries, weighted by the hash share of the respective country. This estimate may be an exaggeration of true mining costs, given that miners may well use energy sources that are materially lower than average electricity costs in the respective country. Perhaps not surprisingly, bitcoin can trade for long stretches below this number.
Currently, prices for bitcoin are below Citi’s estimated cost of mining. Higher power prices should over time lift the cost curve (similar to other commodities) and boost the bitcoin price floor, as miners will need compensation to supply coins and to verify transactions in the proof-of-work system.
Conservative Energy Cost |
Aggressive Energy Cost (last data point end of Feb) |
|
|
|
|
© 2022 Citigroup Inc. No redistribution without Citigroup’s written permission. |
© 2022 Citigroup Inc. No redistribution without Citigroup’s written permission. |
|
Source: Citi Research, University of Cambridge |
Source: Citi Research, University of Cambridge, World Bank Group |


Method 2: Stock to Flow (S2F)
The stock to flow analysis assumes that new bitcoins generated, relative to the existing stock, should have a relationship with the price of the asset. While this will break down when the last bitcoin is mined, more than a century from now, the question is whether this model can for now be a decent guide to understanding bitcoin valuation. So far, stock to flow has worked relatively well, in that the correlation between annual changes in stock/flow and annual changes in bitcoin prices has been loosely positive. The flow of bitcoin can likely be forecast given relatively good estimates for production and the timing of halvings (e.g., when the reward for mining bitcoin transactions is cut in half). Over the long term, the stock to flow model would suggest an exponential rise in bitcoin prices as the difficulty of mining is adjusted bi-weekly and the halving every four years mechanically reduces the flow.
But data are limited. Data are quite limited given the relatively short history of bitcoin trading. The Citi analysts therefore investigate whether the stock to flow model would have worked for gold, a physical asset that may be the closest cousin to bitcoin in the commodity world. As can be seen in the chart below, the relationship between gold prices and the stock-flow measure is weak. While it could be argued that that gold supply is less constrained than for bitcoin, the experience of gold raises doubts about the reliability of using stock to flow. Current prices are below those implied by current stock to flow analysis.
Estimating true stock is also a challenge. Further complicating this analysis is uncertainty with respect to the true availability and narrow control of stocks, whether for physical commodities or bitcoin. For major commodities like oil or corn, large strategic reserves held by governments are not always counted as observable inventory and not fully discounted in the market price. In the case of gold, above-ground stocks are assumed to grow every year and likely see minimal disappearance. But it is unclear how much true tonnage is held outside central bank, exchange, and ETF vaults for buyers. While the number of bitcoin mined-to-date is a verifiable figure, the volume in cold storage, keys or hard-drives permanently lost, etc. is debatable. Arguably, perceptions of “lost bitcoin” exacerbate price exuberance and scarcity, amid a small free-float. But the ability of long-held bitcoin to supply the market given concentrated ownership is also plausible.
Bitcoin Stock-to-Flow with some explanatory power |
But the model does not work for gold |
 |
 |
© 2022 Citigroup Inc. No redistribution without Citigroup’s written permission.Source: Citi Research, Bloomberg, Blockchain.com |
© 2022 Citigroup Inc. No redistribution without Citigroup’s written permission.Source: Citi Research, Bloomberg, WGC, LBMA |
Method 3: Long-term Adoption Relationships
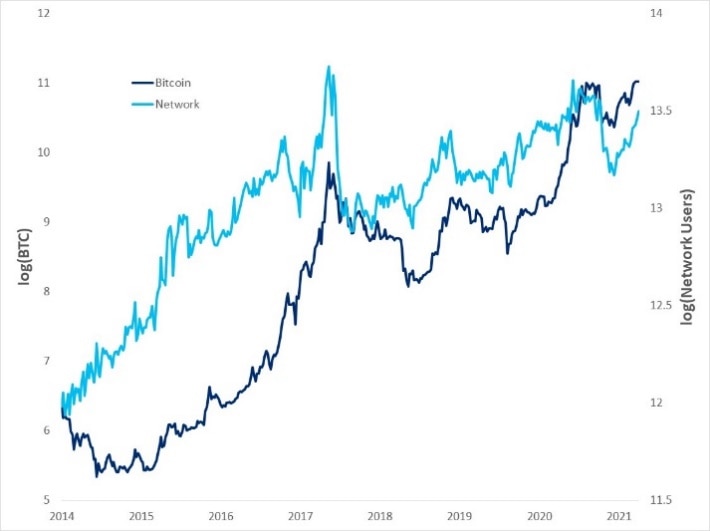
Another methodology is to use long-term relationships to the fundamental utility drivers of the network, adoption and security. These methods borrow from currency analysis or a technology adoption cycle. Citi’s factors revolve around either unique users, and/or hash rates. Adoption is a very important driver of long-term value of a currency, and as such unique users should hold explanatory power for bitcoin as well. The analysts also include the hash rate (total amount of computing power in the system) in the co-integration model. An increasing hash rate, other things being equal, represents a more secure network and should contribute to higher long-term utility. These two charts show that bitcoin does seem to be correlated over time to both hash rates and users – proxied by number of unique active addresses.
New unique addresses as a proxy for adoption |
More hashing power in the network means more security |
|
|
 |
|
© 2022 Citigroup Inc. No redistribution without Citigroup’s written permission. Source: Citi Research, Glassnode, Bloomberg |
© 2022 Citigroup Inc. No redistribution without Citigroup’s written permission. Source: Citi Research, Blockchain.com, Glassnode, Bloomberg |
Method 4: Macro Factor Analysis
The last approach used by the Citi analysts for understanding bitcoin is via macro factors. This is also somewhat similar to what is used to model gold. In the case of gold, Citi strategists think that real rates, DXY, and vol environment are what matter the most. Analysts add a few more factors to understand bitcoin relationships. First, gold itself, but also break-evens, as higher inflation will likely generate more debasement fears and therefore crypto demand. They also include the S&P500 index, as it is also an asset that benefits from plentiful liquidity.
Highest beta factors are S&P and DXY. The two factors with the strongest relationship to bitcoin price changes are S&P, which has a positive relationship with bitcoin prices, and DXY, which has a negative relationship with bitcoin prices.
6m Expanding Betas |
12m Expanding Betas |
|
|
|
|
© 2022 Citigroup Inc. No redistribution without Citigroup’s written permission. |
© 2022 Citigroup Inc. No redistribution without Citigroup’s written permission. |
|
Source: Citi Research, Bloomberg |
Source: Citi Research, Bloomberg |


Betas are stable enough to be useful. The potential problem is that the betas are not that stable. While there are interesting narratives surrounding changing betas, it may be a problem for their explanatory power over time. The analysts therefore also investigate how well having perfect market foresight would have worked with the betas, if it had been known with certainty at the time where all the factors would have been 6m and 12m later. Completely stable betas, with no idiosyncratic variance, would result in a 45-degree line, where the regression would explain 100% of the variation. Unreal as the exercise is, the results are interesting, especially for the 6m horizon.
Model outputs vary depending on the factor expectations used. Depending on factor expectations, the factor model output in 6m is between $52k and $73k and in 12m is between $82k and $121k. This is just one application of the model, as the model betas can be used to scale any factor expectations to understand potential bitcoin drivers.
Model forecasts can be volatile. A drawback of the model is that forecasts can be very variable as every model run assumes that the current value is “fair” and that the future changes depend only on how the factors behave going forward. Correctly forecasting the factors is challenging, of course. However, at the very least, monitoring how macro factors impact bitcoin prices has the potential to be a useful framework.
For more information on this subject and more depth on all four models and their methodology, please see Quantitative Global Macro Strategy - Rules of the Chain: Four Models for Bitcoin
Citi Global Insights (CGI) is Citi’s premier non-independent thought leadership curation. It is not investment research; however, it may contain thematic content previously expressed in an Independent Research report. For the full CGI disclosure, click here.