
A long-term global trend toward electrification is clearly under way. As such, the supply chain that delivers batteries and their components have never been more important. Citi Research analysts have carried out a significant amount of proprietary analysis to map lithium-ion battery supply chain capacity and compared it with demand scenarios. They say the long-term electrification trend remains intact, but there are mismatches along the supply chain caused by the cyclical nature of both demand and capacity growth.
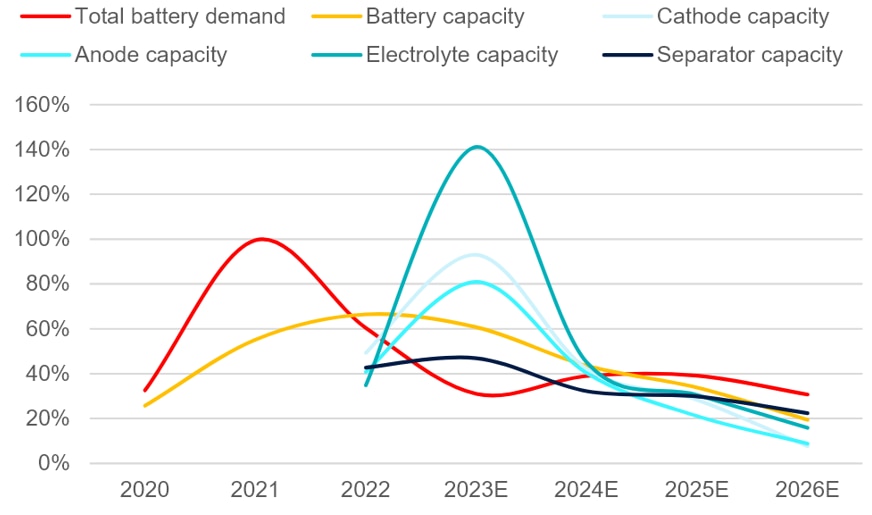
Global Battery Demand vs. Capacity Growth YoY
© 2023 Citigroup Inc. No redistribution without Citigroup’s written permission.
Source: Citi Research, ZE Consulting
- The surge in battery demand in 2021-22 has triggered a wave of capacity increases, as a rise in battery component prices has attracted increased investments. Given the lead time for battery projects, 2023 should see the largest capacity addition across the supply chain while demand growth moderates to ~34% yoy from 102%/58% in 2021/22. The team sees abnormally stronger capacity growth in the cathode, anode, and electrolyte segments whereas battery and separator capacity expansions have been more rational.
- In general, the US Inflation Reduction Act (IRA) and its tax credits look likely to be positive for global electrification in the long run, despite its certain requirements for critical minerals and components. Assuming battery capacity ramps up as planned in the US, there should be enough IRA-compliant battery supply to meet the base-case demand. However, if US battery demand takes off earlier than expected or should there be delays in project ramp-ups, some non-IRA compliant batteries will still be needed. The battery materials companies have been slow to respond to the IRA in announcing capacity plans in the US compared with the battery producers. More project announcements (potentially by Chinese companies) are expected once the Foreign Entity of Concern (FEOC) rule is clarified later this year.
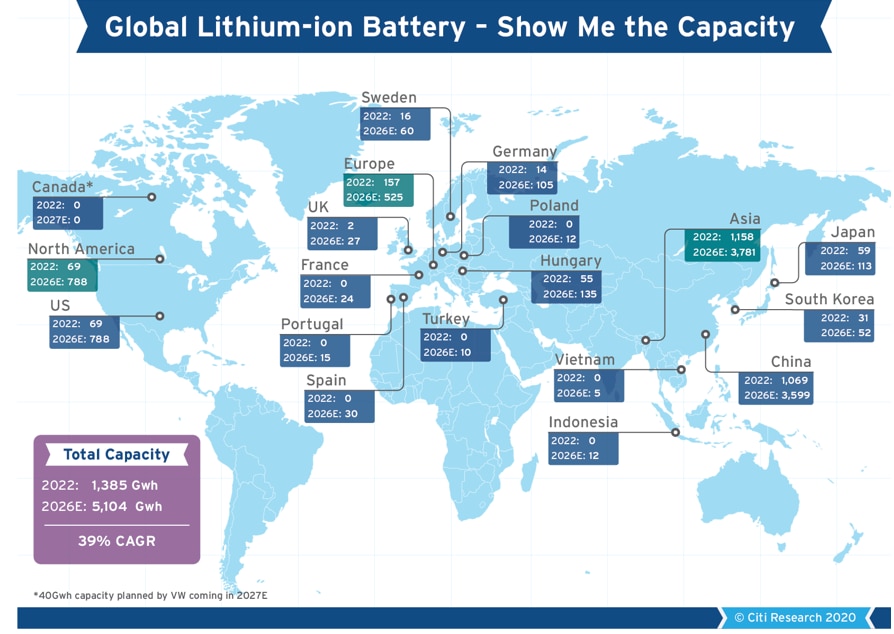
Global Lithium-ion Battery – Show Me the Capacity
© 2023 Citigroup Inc. No redistribution without Citigroup’s written permission.
Source: Citi Research, Company Reports, ZE Consulting, ICCSINO, Real Lithium
The second report presents a granular supply chain model covering the battery, cathode, anode, separator, and electrolyte sections.
Batteries — Battery companies have undergone consolidation in the past few years, and Citi Research analysts say the leaders have started vertical resource integration.
Lithium — The analysts believe upstream producers with high-quality assets will continue to enjoy higher margins through the cycle.
Separators — Rational capacity expansion is attributed to equipment supply bottlenecks.
Anode — The supply-demand balance is worsening as supply outgrows demand.
Electrolyte — The nature of electrolyte production suggests that supply response will be very quick.
Cathode — Cathode margins tend to expand mostly when the overall price of lithium is in an upcycle as they could benefit more from inventory gains and vice-versa.
After assessing the competitive landscape using the Five Forces model, the team’s sector pecking order is: battery > lithium > separator > anode > electrolyte > NCM cathode > LFP cathode. The report contains a detailed model.
Electric vehicles remain the dominant global demand driver for batteries, accounting for 81% of total demand in 2023E. The team’s EV penetration forecast is 58%/38%/16% for China/Europe/US by 2025E and 90%/65%/46% by 2030E.
The long-run electrification story remains strong, but near-term demand could be affected by multiple factors including macroeconomics, consumer sentiment, policy, and energy price. In the base case demand scenario, 2023E China NEV sales are at 8.2m vehicles, up 26% YoY, implying penetration of 37%. This is followed by Europe sales at 2.4m vehicles, up ~4% YoY only, with penetration at 24% (after adjustment for China exports), while US sales are at 1.4m (~1m BEV, rest PHEV), up 66% YoY, with penetration at 10%.
For more information on this subject, and if you are a Velocity subscriber, please see the original full reports here:
Global Battery Materials - Delving Deep into Cyclical Mismatches Along a Structural Trend - Part 1 of 2 (published on 28 July 2023)
Global Battery Materials - Supply Chain Handbook: The Supply Dynamics - Part 2 of 2 (published on 28 July 2023)
Citi Global Insights (CGI) is Citi’s premier non-independent thought leadership curation. It is not investment research; however, it may contain thematic content previously expressed in an Independent Research report. For the full CGI disclosure, click here.