Third Quarter 2020 Results and Key Metrics
HIGHLIGHTS
- Net Income of $3.2 Billion ($1.40 per Share)
- Revenues of $17.3 Billion
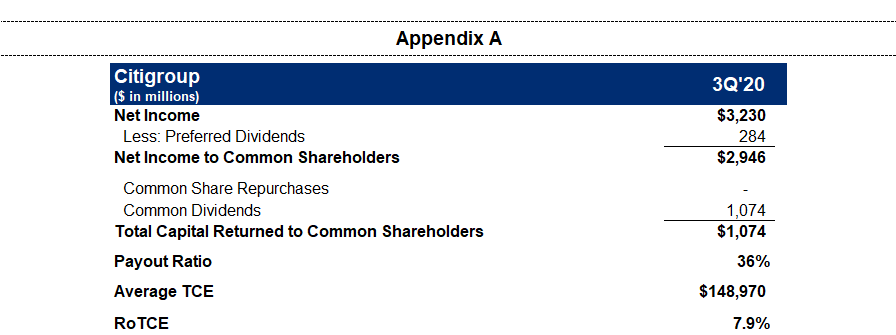
- Returned $1.1 Billion of Capital to Common Shareholders Through Dividends
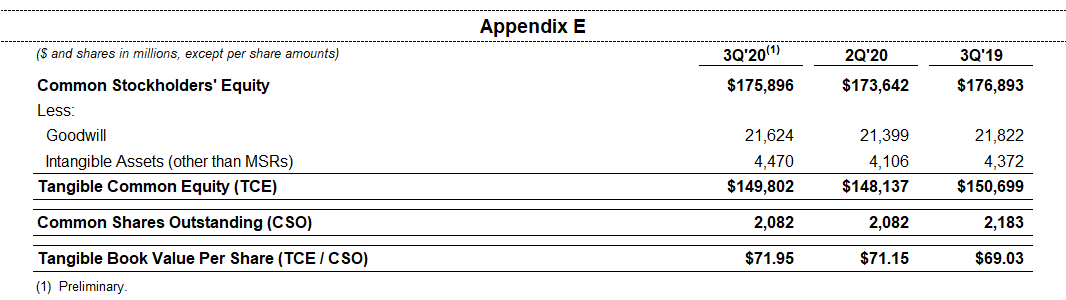
- Book Value per Share of $84.48
- Tangible Book Value per Share of $71.955
Read the full press release with tables and CEO commentary.
View the Financial Supplement (PDF)
View Financial Supplement (Excel)
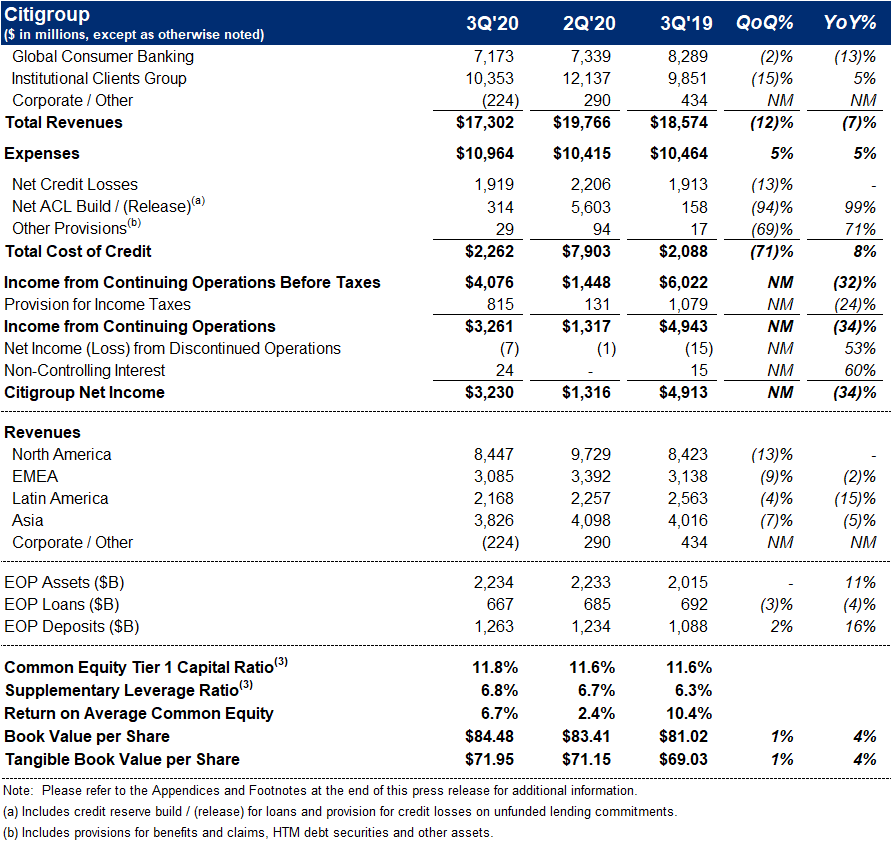
New York – Citigroup Inc. today reported net income for the third quarter 2020 of $3.2 billion, or $1.40 per diluted share, on revenues of $17.3 billion. This compared to net income of $4.9 billion, or $2.07 per diluted share, on revenues of $18.6 billion for the third quarter 2019.
Revenues decreased 7% from the prior-year period, primarily reflecting lower revenues in Global Consumer Banking (GCB) and Corporate / Other, partially offset by growth in Fixed Income Markets, Investment Banking, Equity Markets and the Private Bank in the Institutional Clients Group (ICG). Net income declined 34% from the prior-year period, largely driven by the lower revenues, an increase in expenses and higher credit costs. Results include a $400 million civil money penalty in connection with consent orders recorded in Corporate / Other. Earnings per share of $1.40 decreased 32% from the prior-year period, primarily reflecting the decline in net income.
Michael Corbat, Citi CEO, said, "We continue to navigate the effects of the COVID-19 pandemic extremely well. Credit costs have stabilized; deposits continued to increase; and revenues are up 3% year-to-date. Our Institutional Clients Group again had very strong performance, especially in Markets, Investment Banking and the Private Bank. The backbone of our global network, Treasury and Trade Solutions experienced strong client engagement in the face of low interest rates. Although Global Consumer Banking revenues remained lower as a result of the pandemic, we did see higher activity in our mortgage and wealth management products.
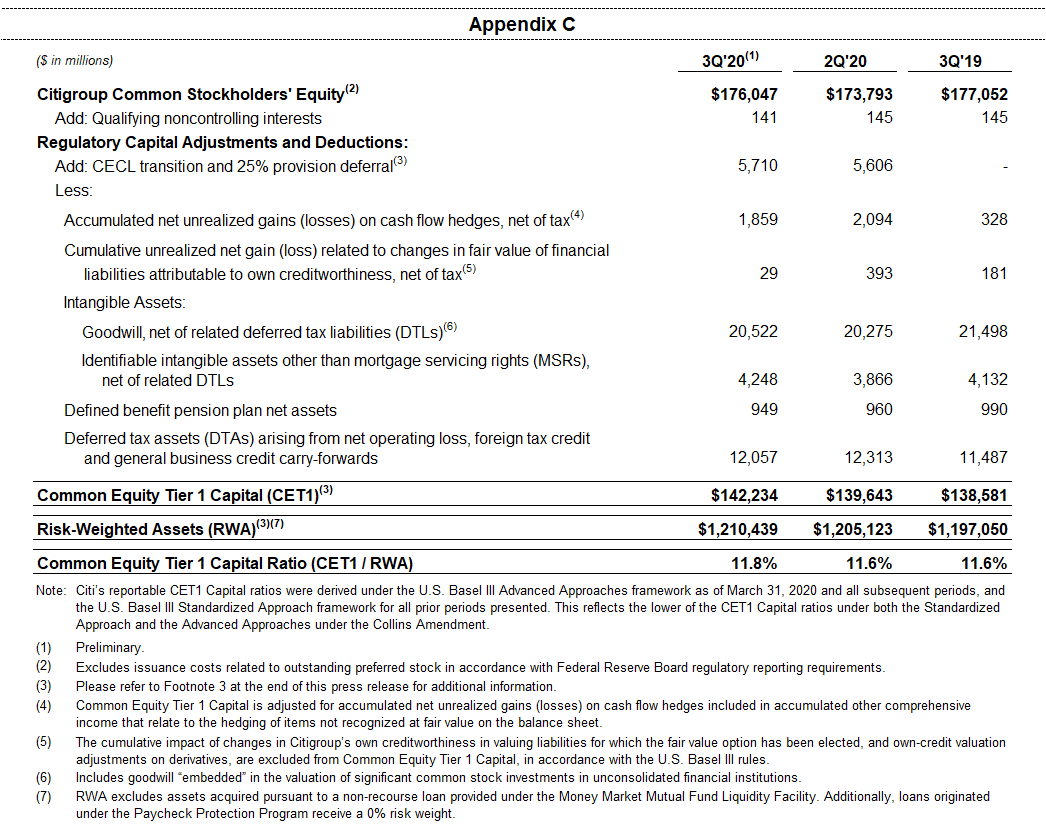
"Our capital position strengthened during the quarter with our Common Equity Tier 1 ratio increasing to 11.8% and our Tangible Book Value per share increasing to $71.95. We remain committed to returning capital to our shareholders, subject to the industry-wide approach determined by the Federal Reserve.
"We are committed to thoroughly addressing the issues contained in the Consent Orders we entered into last week with the Federal Reserve and the Office of the Comptroller of the Currency. These investments will not only further enhance our safety and soundness, they will result in a digital infrastructure that will improve our ability to serve our clients and customers and make us more competitive," Mr. Corbat concluded.
Percentage comparisons throughout this press release are calculated for the third quarter 2020 versus the third quarter 2019, unless otherwise specified.
Citigroup
Citigroup revenues of $17.3 billion in the third quarter 2020 decreased 7%, primarily reflecting the lower revenues in GCB and Corporate / Other, partially offset by the higher revenues in Fixed Income Markets, Investment Banking, Equity Markets and the Private Bank.
Citigroup operating expenses of $11.0 billion in the third quarter 2020 increased 5%, as the civil money penalty, investments in infrastructure, risk management and controls, higher compensation and COVID-19 related expenses more than offset efficiency savings and reductions in marketing and other discretionary spending.
Citigroup cost of credit of $2.3 billion in the third quarter 2020 increased 8%, largely reflecting an increase in ICG allowance for credit loss (ACL) reserves, partially offset by decreases in GCB and Corporate / Other.
Citigroup net income of $3.2 billion in the third quarter 2020 declined 34%, driven by the lower revenues, the higher expenses, the higher cost of credit and a higher effective tax rate. Citigroup's effective tax rate was 20% in the current quarter compared to 18% in the third quarter 2019, reflecting the impact of the non-deductible civil money penalty this quarter.
Citigroup's allowance for credit losses on loans was $26.4 billion at quarter end, or 4.00% of total loans, compared to $12.5 billion, or 1.82% of total loans, at the end of the prior-year period. Total non-accrual assets grew 40% from the prior-year period to $5.3 billion. Consumer non-accrual loans declined 9% to $1.7 billion, while corporate non-accrual loans of $3.6 billion increased 94% from the prior-year period.
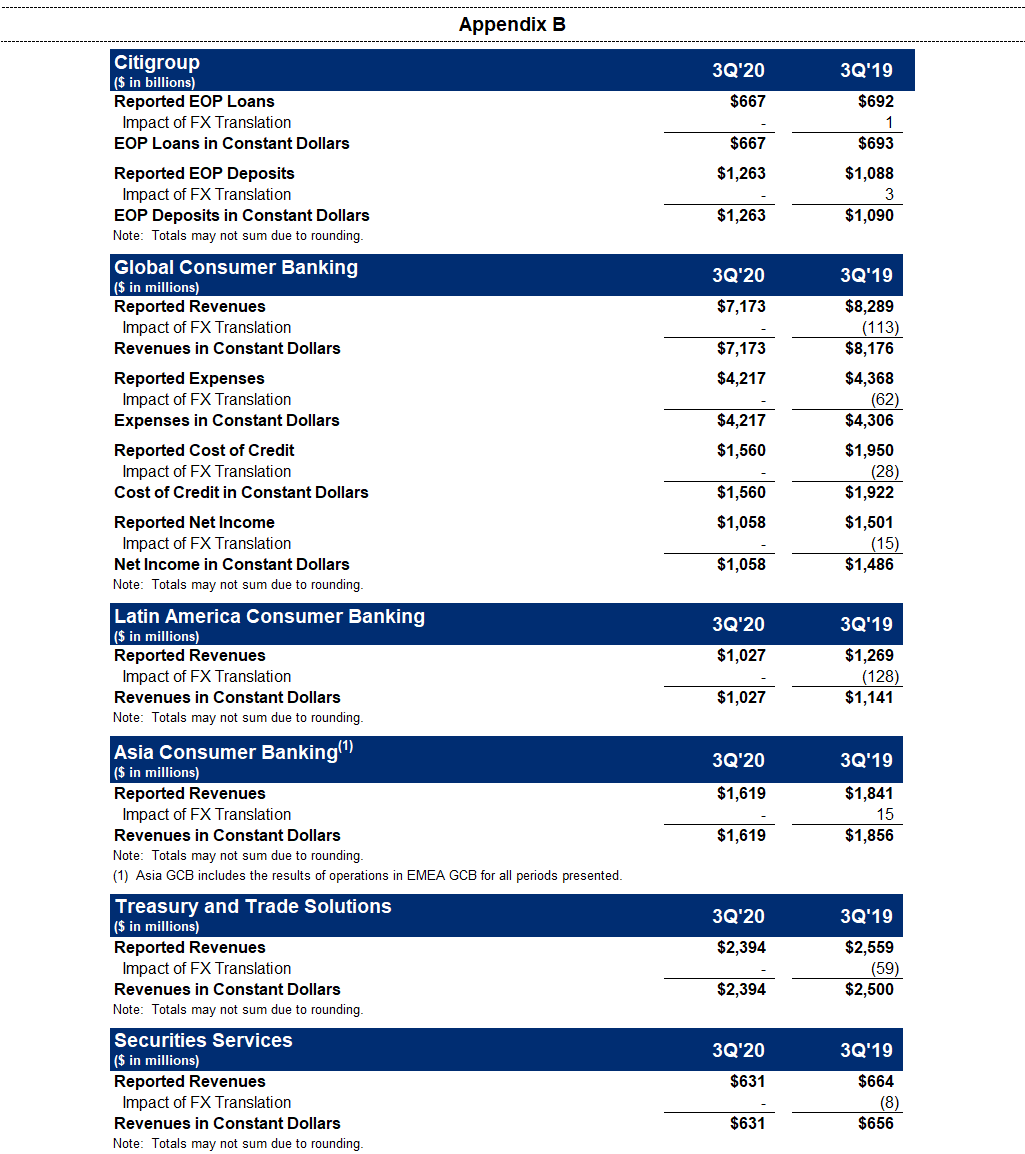
Citigroup's end-of-period loans were $667 billion as of quarter end, down 4% from the prior-year period, as reported and excluding the impact of foreign exchange translation6, driven by declines across GCB and ICG, and the continued wind-down of legacy assets in Corporate / Other.
Citigroup's end-of-period deposits were $1.3 trillion as of quarter end, an increase of 16% from the prior-year period, as reported and in constant dollars6, driven by a 17% increase in GCB and a 16% increase in ICG.
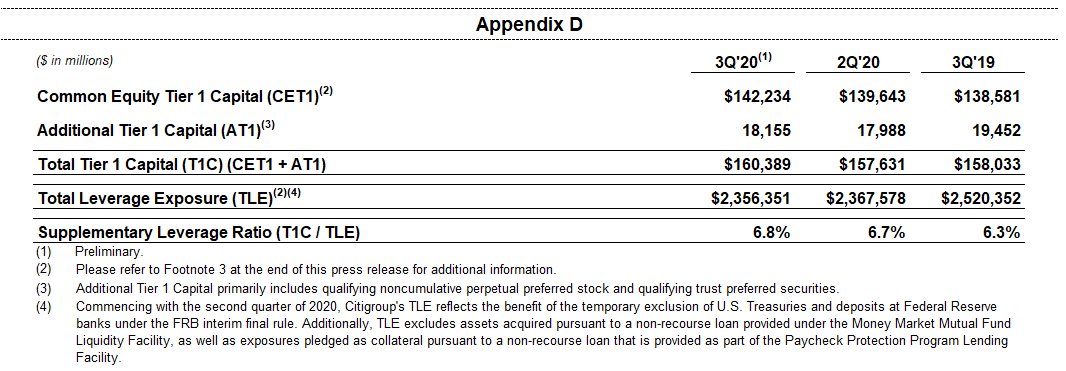
Citigroup's book value per share of $84.48 and tangible book value per share of $71.95 each increased 4% versus the prior-year period, driven by net income. At quarter end, Citigroup's CET1 Capital ratio was 11.8%, up from the prior quarter, driven by net income, partially offset by an increase in risk-weighted assets. Citigroup's SLR for the third quarter 2020 was 6.8%, an increase from the prior quarter. During the quarter, Citigroup returned a total of $1.1 billion to common shareholders in the form of dividends.
Global Consumer Banking
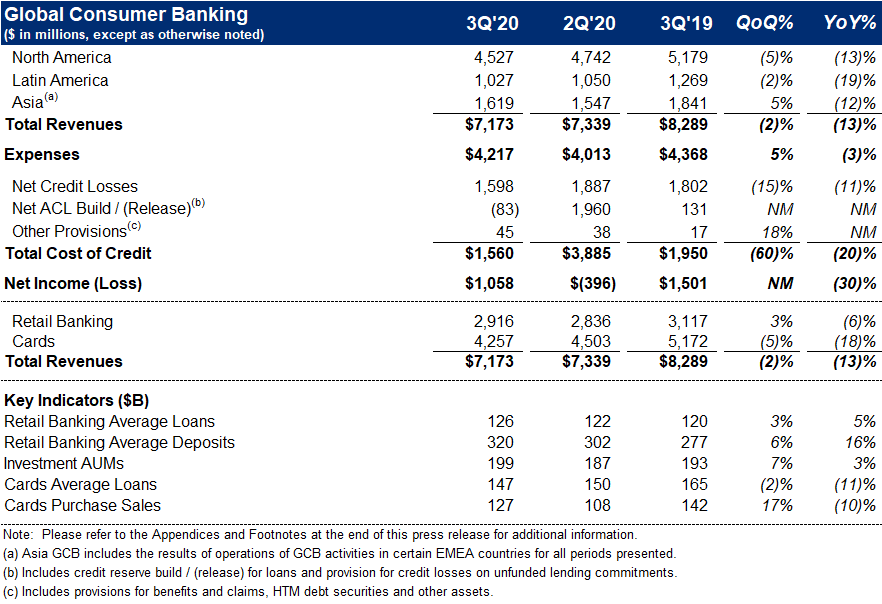
GCB revenues of $7.2 billion decreased 13% on a reported basis and 12% in constant dollars, as strong deposit growth and momentum in Asia wealth management was more than offset by lower card volumes and lower interest rates across all regions, reflecting continued impact from the COVID-19 pandemic.
North America GCB revenues of $4.5 billion decreased 13%. Citi-Branded Cards revenues of $2.1 billion decreased 12%, reflecting lower purchase sales and higher payment rates driving lower average loans. Citi Retail Services revenues of $1.4 billion decreased 21%, reflecting lower average loans as well as higher partner payments. Retail Banking revenues of $1.1 billion decreased 2%, as the benefit of stronger deposit volumes and an improvement in mortgage revenues were more than offset by lower deposit spreads.
Latin America GCB revenues of $1.0 billion declined 19% on a reported basis and 10% in constant dollars, driven by lower average loans and lower interest rates, partially offset by strong deposit growth.
Asia GCB revenues of $1.6 billion declined 12% on a reported basis and 13% in constant dollars, as lower card purchase sales and lower interest rates were partially offset by strong investment revenues.
GCB operating expenses of $4.2 billion decreased 3% on a reported basis and 2% in constant dollars, as lower volume-related expenses, reductions in marketing and other discretionary spending and efficiency savings were partially offset by increases in COVID-19 related expenses.
GCB cost of credit of $1.6 billion decreased 20% on a reported basis and 19% in constant dollars, including an ACL release driven by reduced loan volumes and lower net credit losses given high levels of liquidity in the U.S., lower spending and the benefits of relief programs.
GCB net income of $1.1 billion declined 30% from the prior-year period on a reported basis and 29% in constant dollars, driven by the lower revenues, partially offset by the lower cost of credit and the lower expenses.
Institutional Clients Group
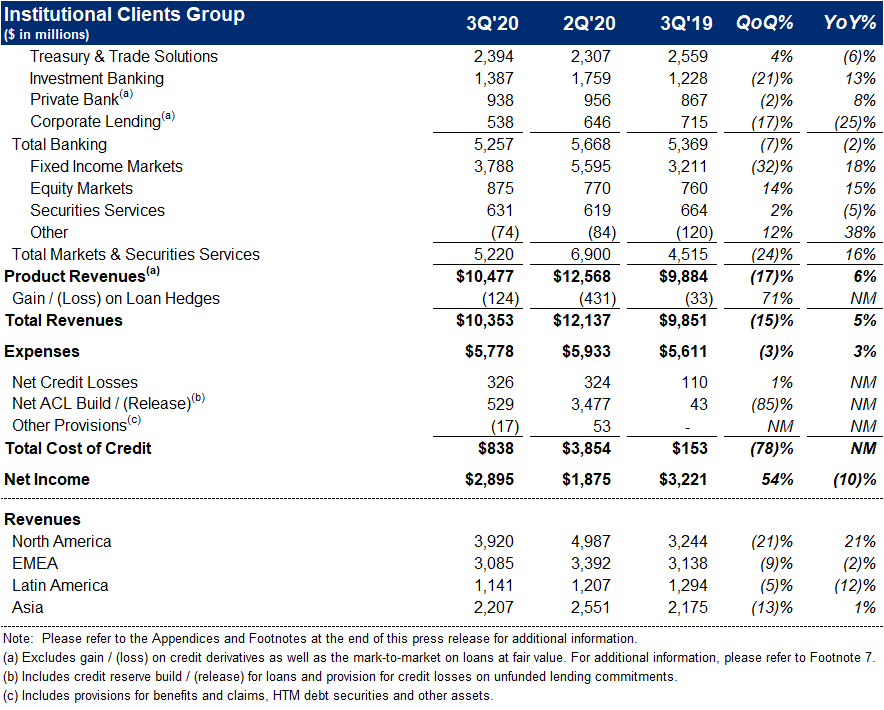
ICG revenues of $10.4 billion increased 5%, as strong performance in Fixed Income Markets, Investment Banking, Equity Markets and the Private Bank was partially offset by lower revenues in Corporate Lending, Treasury and Trade Solutions and Securities Services.
Banking revenues of $5.1 billion decreased 4% versus the prior year (including gain / (loss) on loan hedges)7. Treasury and Trade Solutions revenues of $2.4 billion declined 6% on a reported basis and 4% in constant dollars, as strong client engagement and growth in deposits were more than offset by the impact of lower interest rates and reduced commercial card spend. Investment Banking revenues of $1.4 billion increased 13%, reflecting solid growth in capital markets, particularly in equity underwriting. Advisory revenues decreased 41% to $163 million, while equity underwriting revenues increased 96% to $484 million and debt underwriting revenues increased 5% to $740 million. Private Bank revenues of $938 million increased 8% (excluding gain / (loss) on loan hedges), driven by increased capital markets activity, improved managed investments revenues as well as higher lending and deposit volumes, partially offset by lower deposit spreads. Corporate Lending revenues of $538 million declined 25% (excluding gain / (loss) on loan hedges), as higher loan volumes were more than offset by lower spreads.
Markets and Securities Services revenues of $5.2 billion increased 16%. Fixed Income Markets revenues of $3.8 billion increased 18%, driven by strong performance across spread products and commodities. Equity Markets revenues of $875 million increased 15%, as solid performance in cash equities and derivatives was partially offset by lower revenues in prime finance. Securities Services revenues of $631 million decreased 5% on a reported basis and 4% in constant dollars, as higher deposit volumes were more than offset by lower spreads.
ICG net income of $2.9 billion decreased 10%, as the revenue growth was more than offset by higher cost of credit and expenses. ICG operating expenses increased 3% to $5.8 billion, driven by continued investments in infrastructure, risk management and controls, as well as higher compensation costs. ICG cost of credit included net credit losses of $326 million, compared to $110 million in the prior-year period, and an ACL build of $529 million compared to a build of $43 million in the prior-year period, reflecting the impact of continuing uncertainty surrounding the macroeconomic outlook.
Corporate / Other
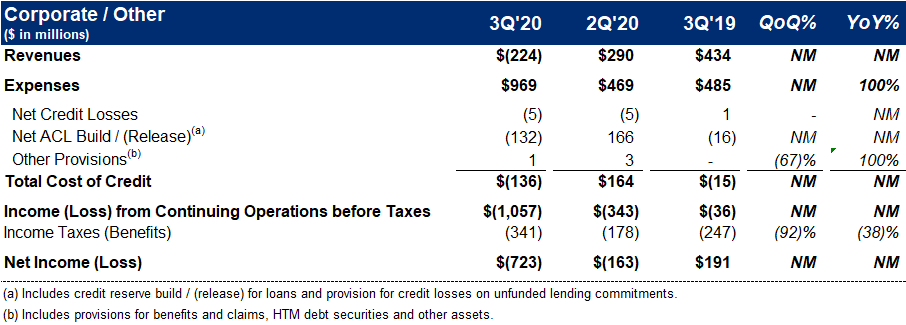
Corporate / Other revenues of $(224) million compared to $434 million in the prior-year period, reflecting the wind-down of legacy assets, the impact of lower rates and marks on securities.
Corporate / Other expenses of $969 million increased significantly, as the wind-down of legacy assets was more than offset by the civil money penalty, investments in infrastructure, risk management and controls and incremental costs associated with COVID-19.
Corporate / Other loss from continuing operations before taxes of $(1.1) billion compared to a loss of $(36) million in the prior-year period, driven by the lower revenues and the increased expenses, partially offset by a larger ACL release on the legacy portfolio.
Citigroup will host a conference call today at 10:00 a.m. (ET). A live webcast of the presentation, as well as financial results and presentation materials, will be available at https://www.citigroup.com/global/investors. Dial-in numbers for the conference call are as follows: (866) 516-9582 in the U.S. and Canada; (973) 409-9210 outside of the U.S. and Canada. The conference code for both numbers is 9492234.
Additional financial, statistical and business-related information, as well as business and segment trends, is included in a Quarterly Financial Data Supplement. Both this earnings release and Citigroup's Third Quarter 2020 Quarterly Financial Data Supplement are available on Citigroup's website at www.citigroup.com.
Citi
Contacts: