
Second Quarter 2022 Results and Key Metrics

HIGHLIGHTS
- Returned $1.3 Billion of Capital to Common Shareholders in the Form of Dividends and Repurchases
- Payout Ratio of 29%3
- Book Value per Share of $92.95
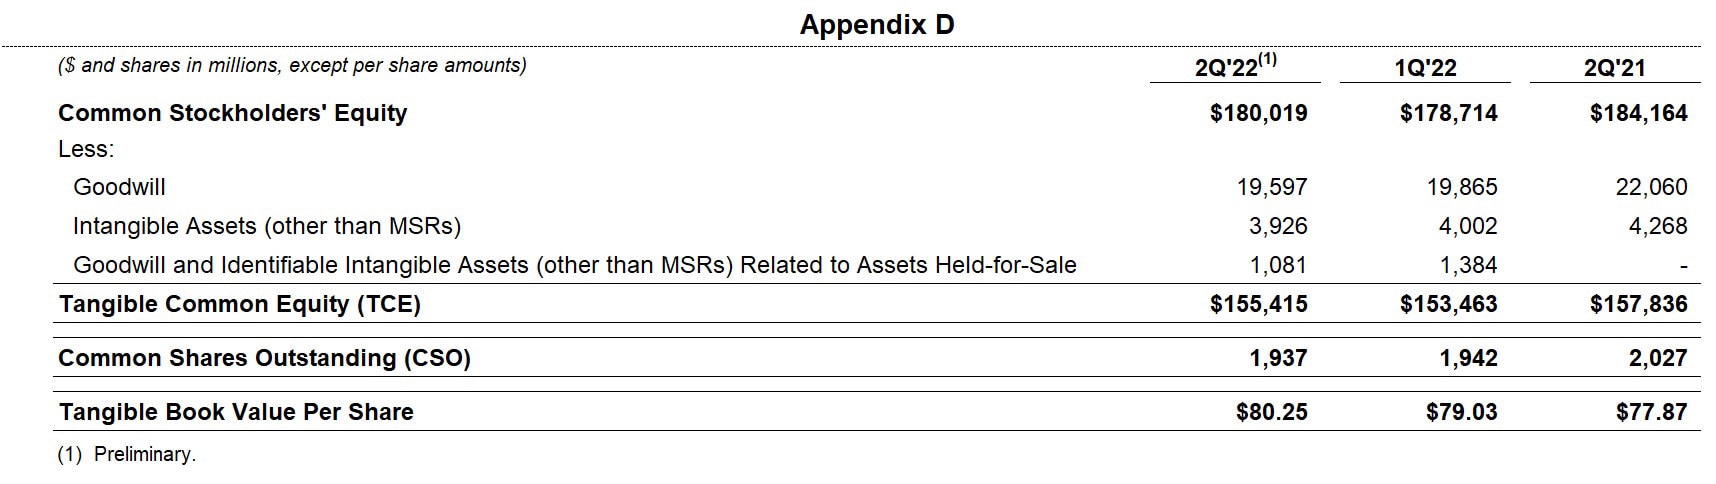
- Tangible Book Value per Share of $80.254
Read the full press release with tables and CEO commentary.
View the Financial Supplement (PDF)
View Financial Supplement (Excel)
New York – Citigroup Inc. today reported net income for the second quarter 2022 of $4.5 billion, or $2.19 per diluted share, on revenues of $19.6 billion. This compared to net income of $6.2 billion, or $2.85 per diluted share, on revenues of $17.8 billion for the second quarter 2021.
Revenues increased 11% from the prior-year period, with growth in both net interest income as well as non-interest revenue. Higher net interest income was primarily driven by the benefits of higher rates as well as strong volumes across Institutional Clients Group (ICG) and Personal Banking and Wealth Management (PBWM). Non-interest revenue also increased, driven by Fixed Income Markets and Services in ICG, which more than offset lower non-interest revenue in Investment Banking in ICG and PBWM.
Net income of $4.5 billion decreased 27% from the prior-year period, as higher cost of credit and an 8% increase in expenses more than offset the 11% increase in revenues.
Earnings per share of $2.19 decreased 23% from the prior-year period, reflecting the lower net income, partly offset by an approximate 4% decline in shares outstanding.
Citi CEO Jane Fraser said, "While the world has changed since our Investor Day in March, our strategy has not and we are executing it with discipline and urgency. Treasury and Trade Solutions fired on all cylinders as clients took advantage of our global network, leading to the best quarter this business has had in a decade. Trading volatility continued to create strong corporate client activity for us, driving revenue growth of 25% in Markets. While economic sentiment clearly impacted Investment Banking and Wealth Management, we continue to invest in these businesses and we like where they are headed. In U.S. Personal Banking, the positive drivers we saw in our two credit cards businesses over the last few quarters converted into solid revenue growth this quarter, most notably a 10% growth in Branded Cards.
"In a challenging macro and geopolitical environment, our team delivered solid results and we are in a strong position to weather uncertain times, given our liquidity, credit quality and reserve levels. I am particularly pleased with our capital strength. We ended the quarter with a Common Equity Tier 1 ratio of 11.9%, having built capital due to a higher regulatory requirement. We intend to generate significant capital for our investors, given our earnings power and the upcoming divestitures," Ms. Fraser concluded.
Percentage comparisons throughout this press release are calculated for the second quarter 2022 versus the second quarter 2021, unless otherwise specified.
Second Quarter Financial Results

Citigroup
Citigroup revenues of $19.6 billion in the second quarter 2022 increased 11%, driven by increased rates, client activity in Markets and continued momentum in the U.S. cards businesses, partially offset by a slowdown in Investment Banking activity as well as investment fee headwinds in Global Wealth Management.
Citigroup operating expenses of $12.4 billion in the second quarter 2022 increased 8%, driven by continued investments in Citi's transformation, higher business-led investments and volume-related expenses, partially offset by productivity savings.
Citigroup cost of credit of $1.3 billion in the second quarter 2022 compared to $(1.1) billion in the prior-year period, reflecting a net build in the allowance for credit losses (ACL) of $0.4 billion, compared to a net ACL release of $2.4 billion in the prior-year period, partially offset by lower net credit losses.
Citigroup net income of $4.5 billion in the second quarter 2022 decreased 27% from the prior-year period, driven by the higher cost of credit and the higher expenses, partially offset by the increase in revenues. Citigroup's effective tax rate was 19.8% in the current quarter versus 15.7% in the second quarter 2021. The higher tax rate for the current quarter reflected lower tax benefits related to certain non-U.S. operations.
Citigroup's total allowance for credit losses on loans was approximately $16.0 billion at quarter end, with a reserve-to-funded loans ratio of 2.44%, compared to $19.2 billion, or 2.88% of funded loans, at the end of the prior-year period. Total non-accrual loans decreased 31% from the prior-year period to $3.0 billion. Consumer non-accrual loans decreased 35% to $1.4 billion, while corporate non-accrual loans of $1.7 billion decreased 26% from the prior-year period.
Citigroup's end-of-period loans were $657 billion as of quarter end, down 3% versus the prior-year period.
Citigroup's end-of-period deposits were $1.3 trillion as of quarter end, up 1% versus the prior-year period.
Citigroup's book value per share of $92.95 and tangible book value per share of $80.25 increased 2% and 3%, respectively, largely driven by net income and lower shares outstanding, partially offset by adverse movements in the accumulated other comprehensive income component of equity and common dividends. At quarter end, Citigroup's CET1 Capital ratio was 11.9% versus 11.4% in the prior quarter. Citigroup's SLR for the second quarter 2022 was 5.6%, unchanged from the prior quarter. During the quarter, Citigroup returned a total of $1.3 billion to common shareholders in the form of dividends and repurchases.
Institutional Clients Group
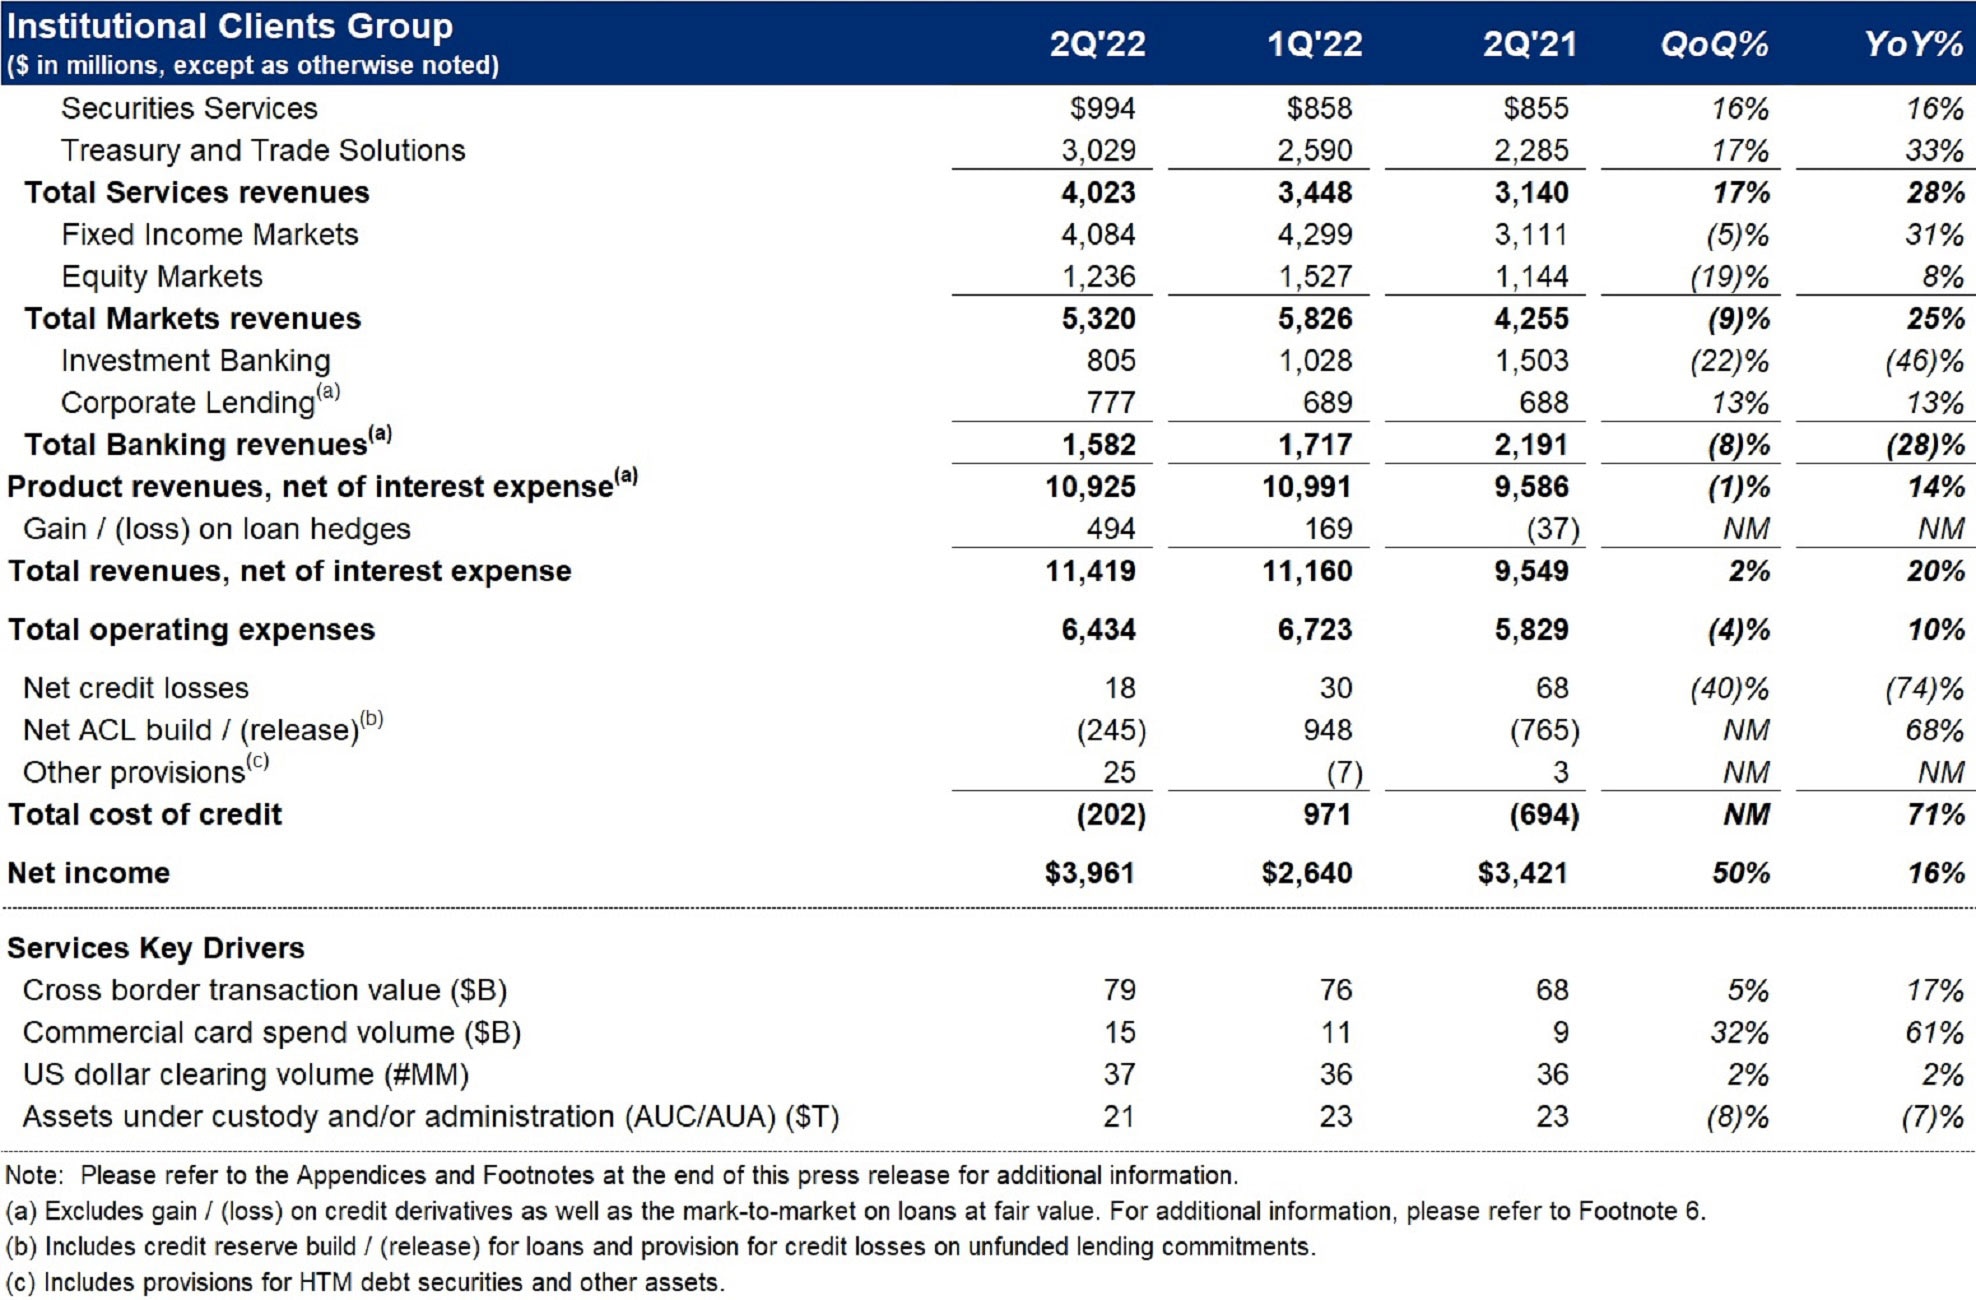
ICG revenues of $11.4 billion increased 20% (including gain/(loss) on loan hedges(6)), driven by Services and Markets, partially offset by a decrease in Investment Banking revenues.
Services revenues of $4.0 billion increased 28% versus the prior year. Treasury and Trade Solutions revenues of $3.0 billion increased 33%, driven by 42% growth in net interest income, as well as 17% growth in non-interest revenue, reflecting strong growth with both mid and large corporate clients. Securities Services revenues of $994 million increased 16%, as net interest income grew 41%, driven by higher interest rates across currencies, and non-interest revenue grew 8%, reflecting elevated levels of corporate settlement activity in Issuer Services.
Markets revenues of $5.3 billion were up 25% versus the prior year, driven by higher volatility leading to elevated client engagement. Fixed Income Markets revenues of $4.1 billion increased 31%, primarily reflecting strong client engagement in the rates, currencies and commodities businesses. Equity Markets revenues of $1.2 billion were up 8%, driven by strong equity derivatives performance, partially offset by less client activity in cash, and a net decrease in prime balances, as lower asset valuations more than offset new client balances.
Banking revenues of $2.1 billion decreased 4% versus the prior-year period (including gain/(loss) on loan hedges). Excluding the gain/(loss) on loan hedges, Banking revenues of $1.6 billion decreased 28% versus the prior year. Investment Banking revenues of $805 million declined 46%, as heightened geopolitical uncertainty and the overall macroeconomic backdrop reduced capital markets activity and M&A. The decline in Investment Banking revenues were partially offset by higher revenues in Corporate Lending.
ICG operating expenses of $6.4 billion increased 10%, driven by continued investments in Citi's transformation, higher business-led investments and volume-related expenses, partially offset by productivity savings.
ICG cost of credit of $(202) million compared to $(694) million in the prior-year period, with a net ACL release of $245 million and net credit losses of $18 million. The release was largely driven by a reduction in Russia-related risk in the quarter, partially offset by a build due to increased macroeconomic uncertainty.
ICG net income of $4.0 billion increased 16% from the prior year, driven by the higher revenues, partially offset by the higher expenses and the higher cost of credit.
Personal Banking and Wealth Management
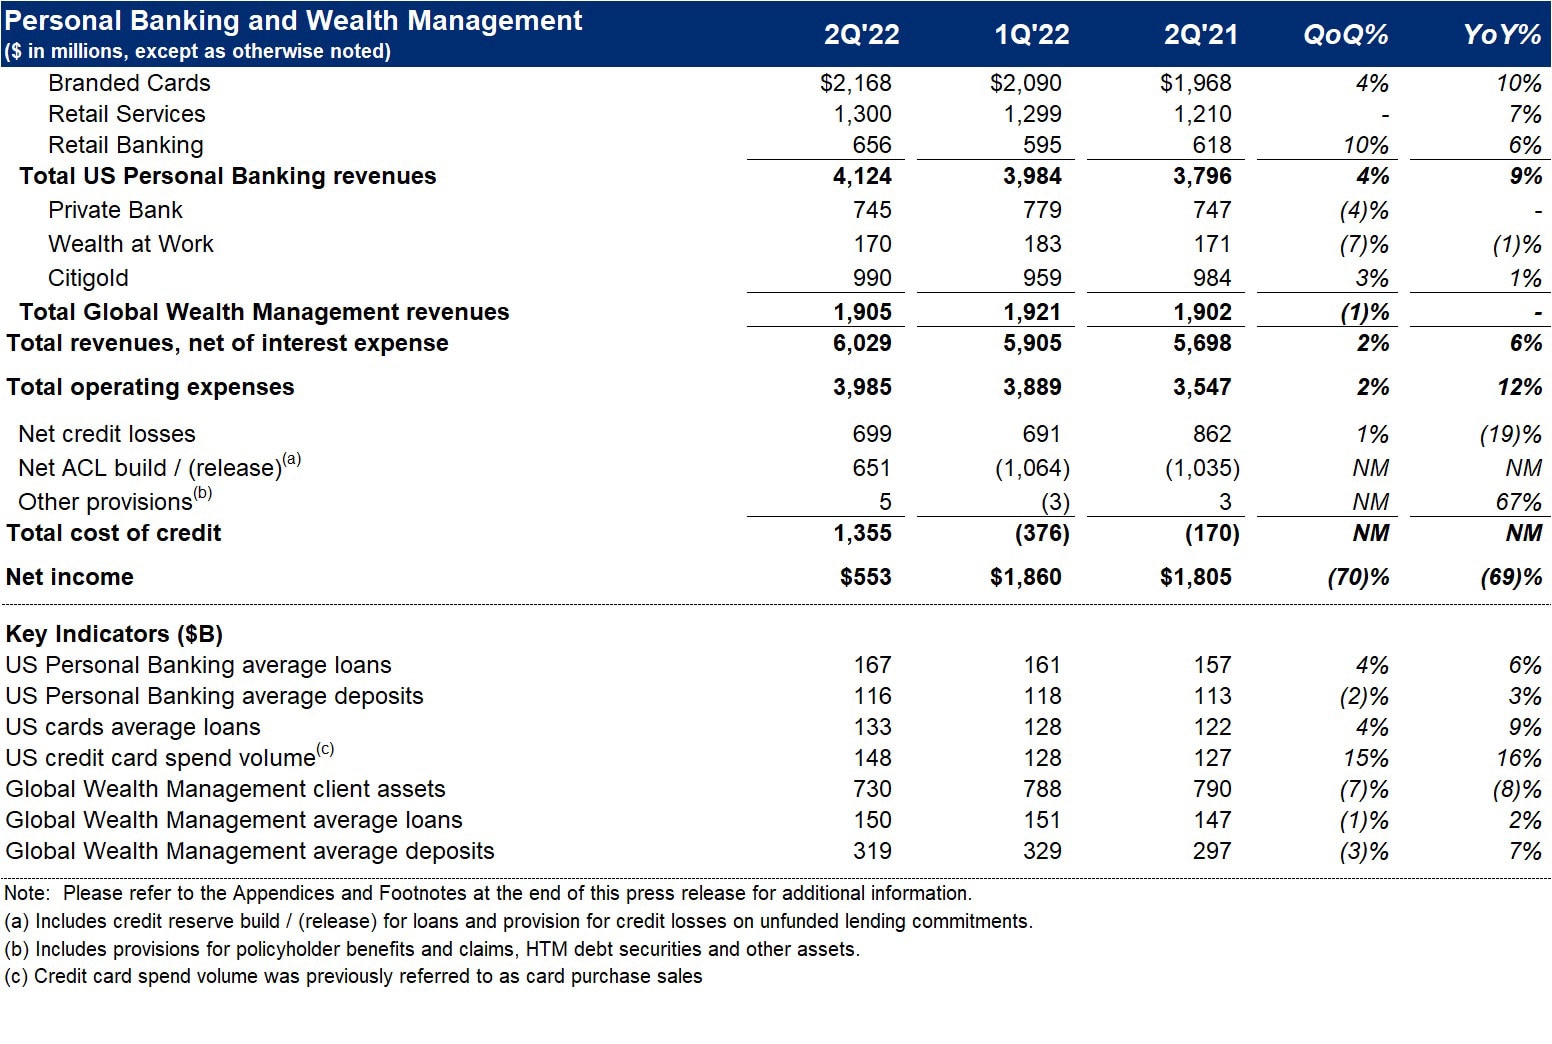
PBWM revenues of $6.0 billion increased 6%, as net interest income growth was partially offset by a decline in non-interest revenue, largely driven by partner payments in Retail Services.
US Personal Banking revenues of $4.1 billion increased 9%. Branded Cards revenues of $2.2 billion increased 10%, driven by higher interest on higher loan balances. New accounts and card spend volumes increased 18%, while average loans increased 11%. Retail Services revenues of $1.3 billion increased 7%, driven by higher interest on higher loan balances, partially offset by higher partner payments. Retail Banking revenues of $656 million increased 6%, largely driven by higher deposit spreads and volumes.
Global Wealth Management revenues of $1.9 billion were flat, as investment fee headwinds, particularly in Asia, were offset by growth in average deposits and loans.
PBWM operating expenses of $4.0 billion increased 12%, driven by continued investments in Citi's transformation, higher business-led investments and volume-driven expenses, partially offset by productivity savings.
PBWM cost of credit of $1.4 billion compared to $(170) million in the prior-year period, largely driven by a net ACL build of $651 million in the current quarter, compared to a net ACL release of $1.0 billion in the prior-year period, reflecting increased macroeconomic uncertainty. Net credit losses declined 19%, reflecting continued strong credit performance across portfolios.
PBWM net income of $553 million decreased 69%, largely driven by the higher expenses and the ACL build, partially offset by the higher revenues.
Legacy Franchises
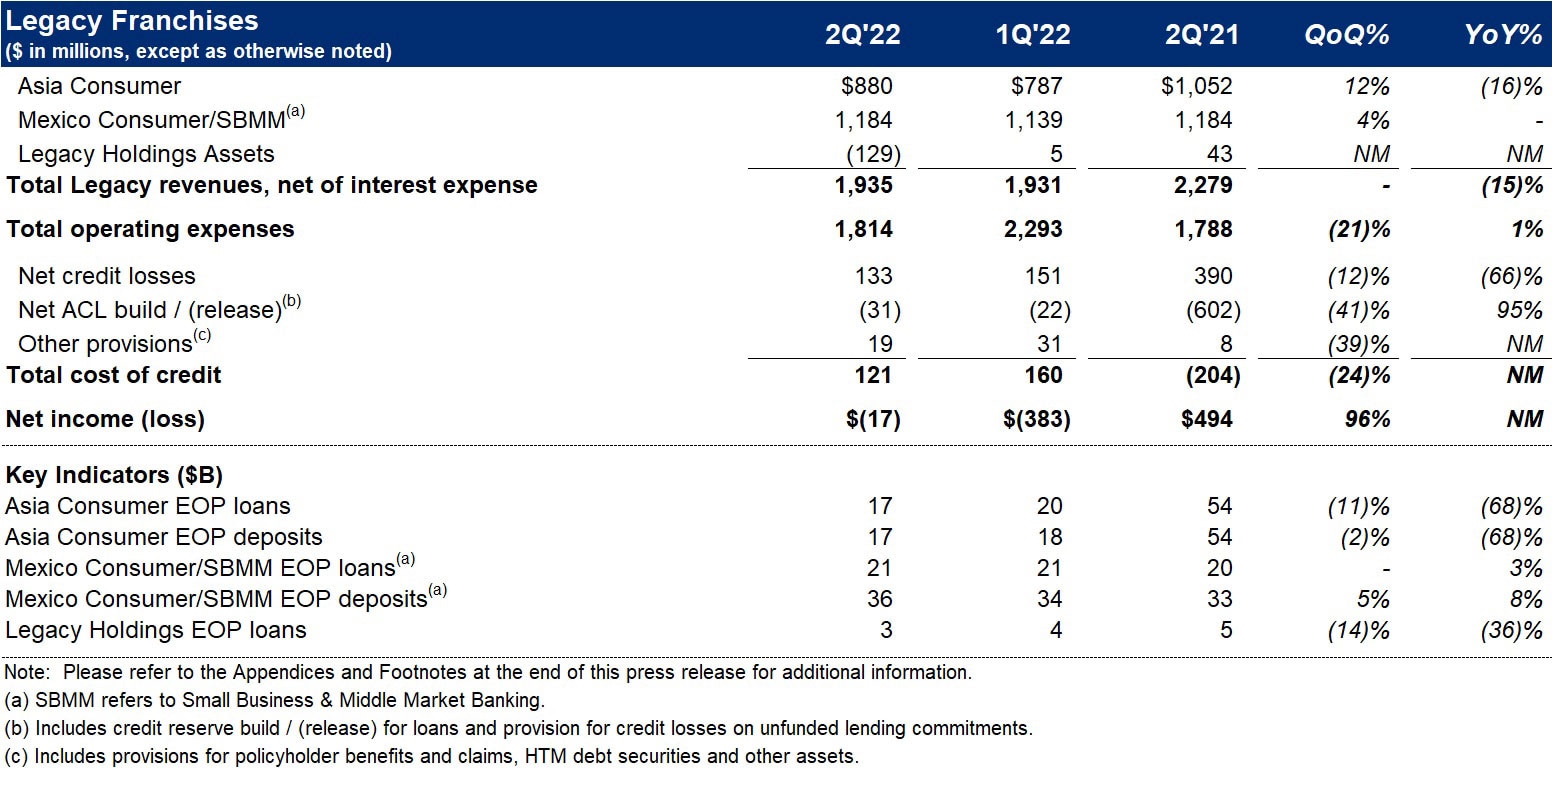
Legacy Franchises revenues of $1.9 billion decreased 15% versus the prior year, largely driven by the impacts related to the Australia consumer banking sale and Korea wind-down, as well as lower investment activity in Asia Consumer.
Legacy Franchises expenses of $1.8 billion increased 1%.
Legacy Franchises cost of credit of $121 million compared to $(204) million in the prior-year period, primarily driven by a lower net ACL release, partially offset by lower net credit losses.
Legacy Franchises net income of $(17) million compared to net income of $494 million in the prior-year period, reflecting the lower revenues, the higher expenses and the higher cost of credit.
Corporate / Other
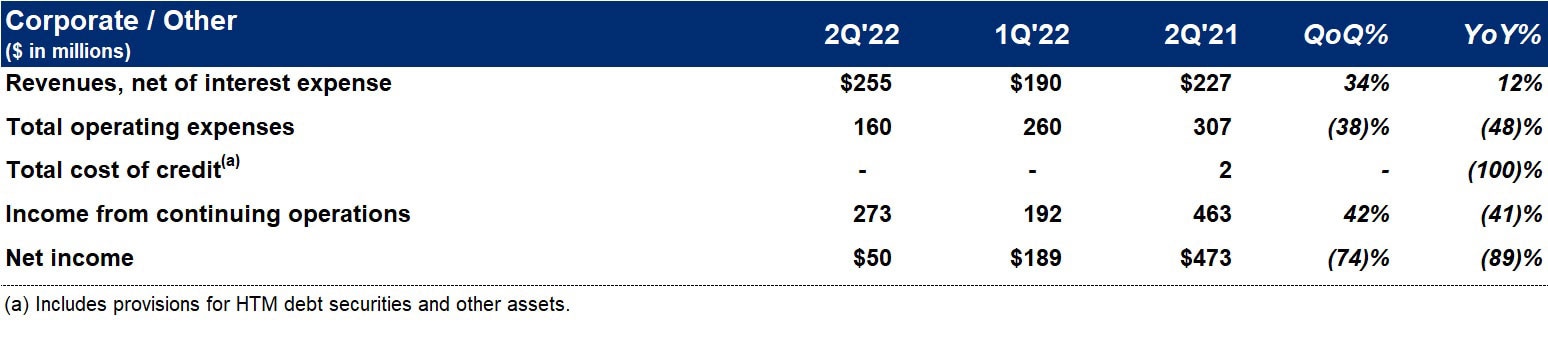
Corporate / Other revenues of $255 million increased 12%, largely driven by higher net revenues from the investment portfolio.
Corporate / Other expenses of $160 million decreased 48% versus the prior-year period, driven by certain settlements and the impact of foreign currency translation into U.S. Dollars for reporting purposes.
Corporate / Other income from continuing operations of $273 million compared to $463 million in the prior-year period, largely reflecting lower tax benefits related to certain non-U.S. operations.
Citigroup will host a conference call today at 11 a.m. (ET). A live webcast of the presentation, as well as financial results and presentation materials, will be available at https://www.citigroup.com/global/investors. Dial-in numbers for the conference call are as follows: (800) 343-1703 (for U.S. and Canada callers) or (203) 518-9859 (for international callers).
Additional financial, statistical and business-related information, as well as business and segment trends, is included in a Quarterly Financial Data Supplement. Both this earnings release and Citigroup's Second Quarter 2022 Quarterly Financial Data Supplement are available on Citigroup's website at www.citigroup.com.
Citi
Citi is a preeminent banking partner for institutions with cross-border needs, a global leader in wealth management and a valued personal bank in its home market of the United States. Citi does business in more than 160 countries and jurisdictions, providing corporations, governments, investors, institutions and individuals with a broad range of financial products and services.
Additional information may be found at www.citigroup.com | Twitter: @Citi | YouTube: www.youtube.com/citi | Blog: http://blog.citigroup.com | Facebook: www.facebook.com/citi | LinkedIn: www.linkedin.com/company/citi
Certain statements in this release are "forward-looking statements" within the meaning of the rules and regulations of the Private Securities Litigation and Reform Act of 1995. These statements are based on management's current expectations and are subject to uncertainty and changes in circumstances. These statements are not guarantees of future results or occurrences. Actual results and capital and other financial condition may differ materially from those included in these statements due to a variety of factors. These factors include, among others: the impacts related to or resulting from Russia's military action in Ukraine, including the imposition of additional sanctions and export controls, as well as the broader impacts to financial markets and the global macroeconomic and geopolitical environments; higher inflation and its impacts; higher interest rates and the impacts on macroeconomic conditions, customer and client behavior, as well as Citi's funding costs; macroeconomic and other challenges and uncertainties related to the COVID-19 pandemic, such as the impacts to the U.S. and global economies; consummation of Citi's exits and wind-down, and the impact of any additional CTA or other losses; and the precautionary statements included in this release. These factors also consist of those contained in Citigroup's filings with the U.S. Securities Exchange and Commission, including without limitation the "Risk Factors" section of Citigroup's 2021 Form 10-K. Any forward-looking statements made by or on behalf of Citigroup speak only as to the date they are made, and Citi does not undertake to update forward-looking statements to reflect the impact of circumstances or events that arise after the date the forward-looking statements were made.
Contacts:
Investors: Jennifer Landis (212) 559-2718
Press: Danielle Romero-Apsilos (212) 816-2264
Click here for the complete press release and summary financial information.
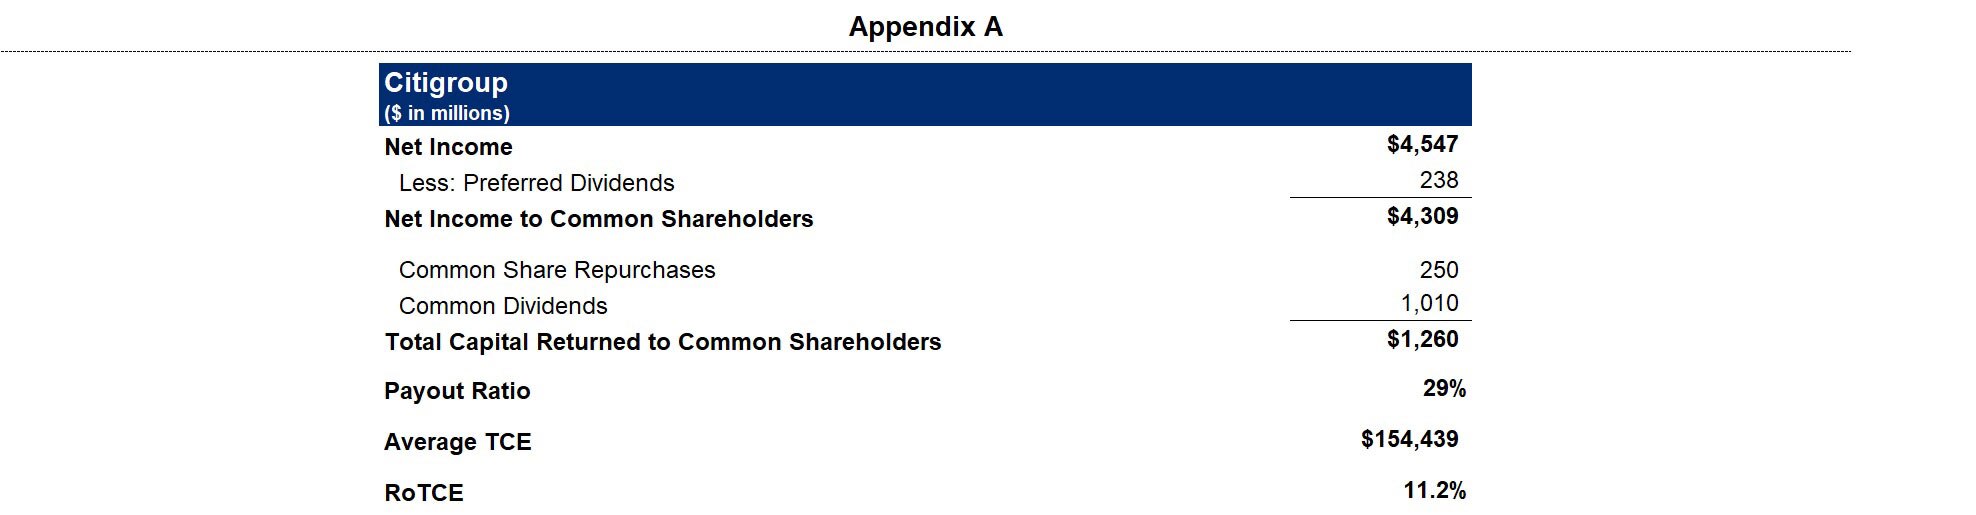

1 Preliminary. Citigroup's return on average tangible common equity (RoTCE) is a non-GAAP financial measure. RoTCE represents annualized net income available to common shareholders as a percentage of average tangible common equity (TCE). For the components of the calculation, see Appendix A.
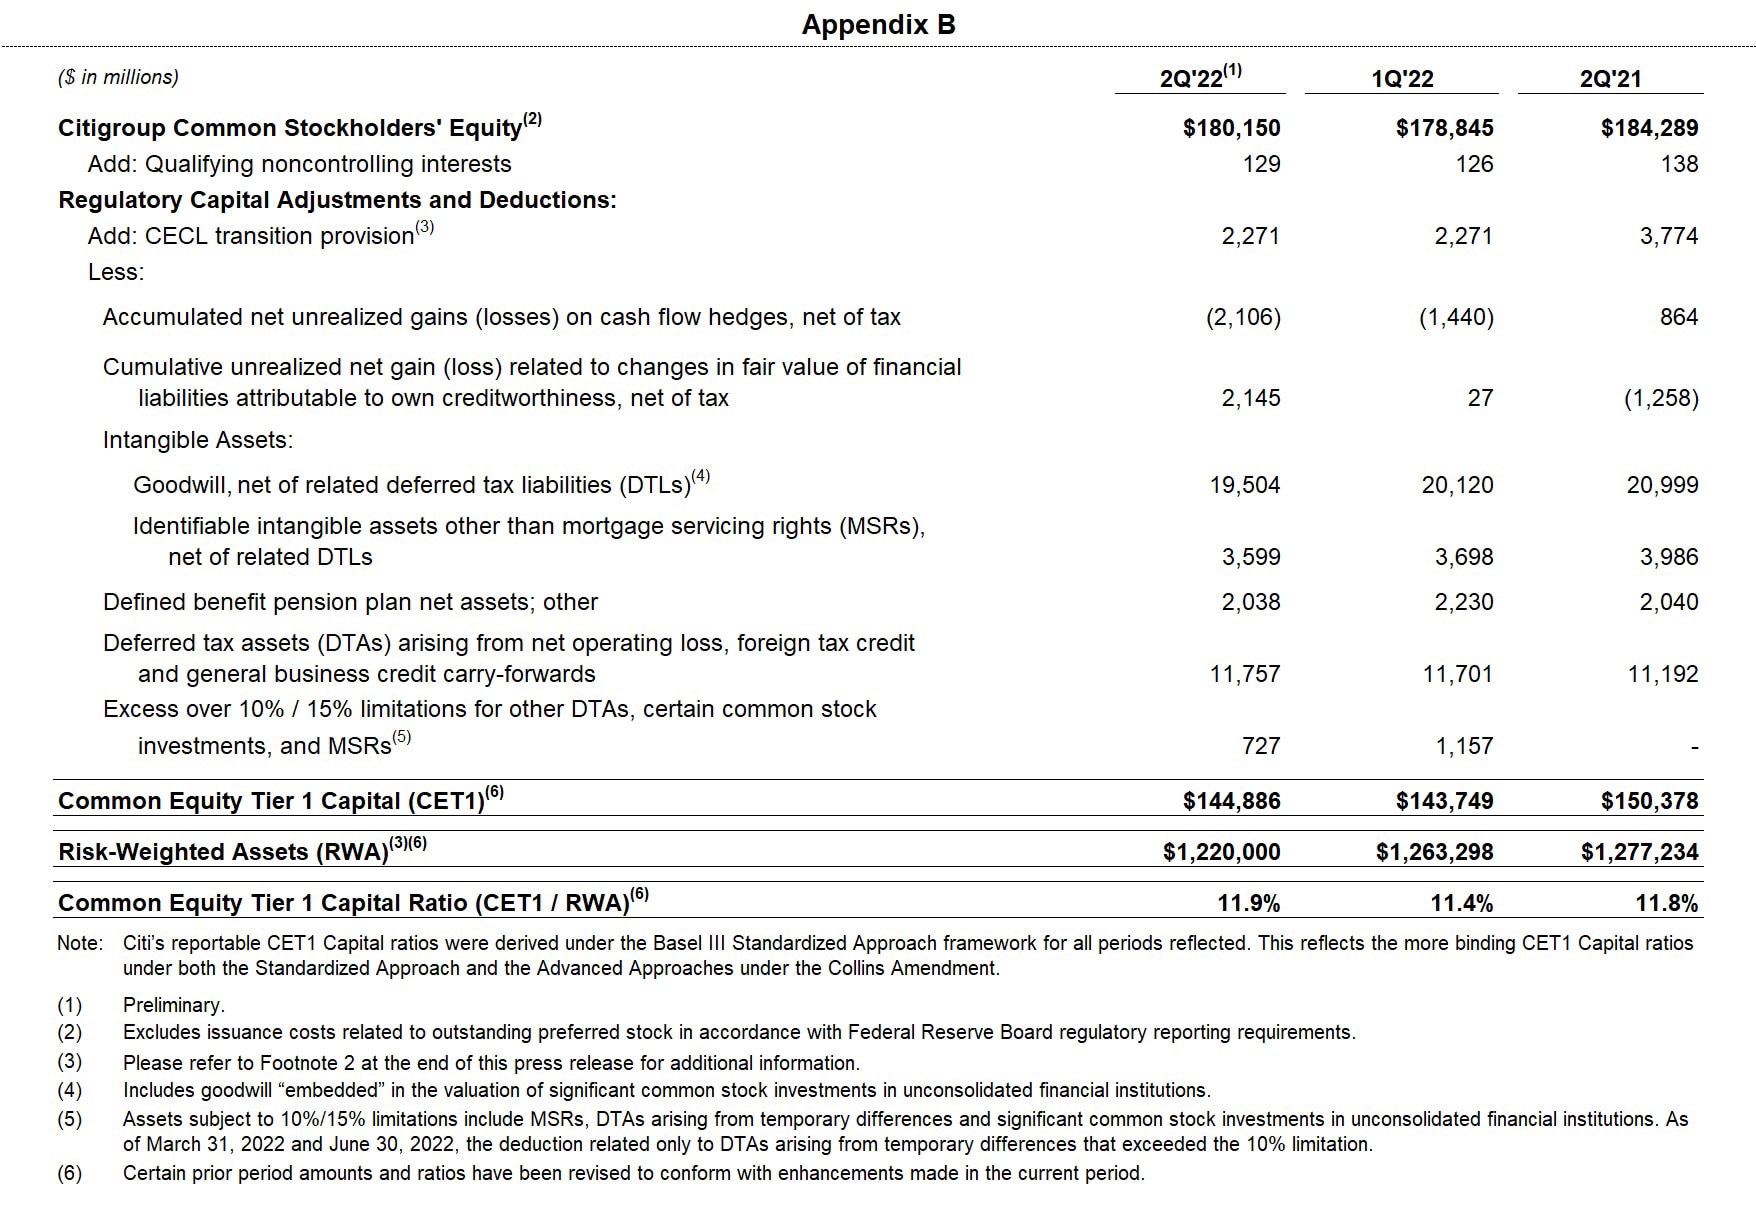
2 Ratios as of June 30, 2022 are preliminary. Citigroup's Common Equity Tier 1 (CET1) Capital ratio and Supplementary Leverage ratio (SLR) reflect certain deferrals based on the modified regulatory capital transition provision related to the Current Expected Credit Losses (CECL) standard. Excluding these deferrals, Citigroup's CET1 Capital ratio and SLR as of June 30, 2022 would be 11.7% and 5.5%, respectively, on a fully reflected basis. For additional information, please refer to the "Capital Resources" section of Citigroup's 2021 Annual Report on Form 10-K. Certain prior-period amounts have been revised to conform with enhancements made in the current period.
For the composition of Citigroup's CET1 Capital and ratio, see Appendix B. For the composition of Citigroup's SLR, see Appendix C.
3 Citigroup's payout ratio is the sum of common dividends and common share repurchases divided by net income available to common shareholders. For the components of the calculation, see Appendix A.
4 Citigroup's tangible book value per share is a non-GAAP financial measure. For a reconciliation of this measure to reported results, see Appendix D.
5 Second quarter 2022 discontinued operations reflects the release of a currency translation adjustment (CTA) loss (net of hedges) recorded in Accumulated Other Comprehensive Income (AOCI) related to the substantial liquidation of a legal entity (with a non-U.S. dollar functional currency) that had previously divested a legacy business.
6 Credit derivatives are used to economically hedge a portion of the Corporate Loan portfolio that includes both accrual loans and loans at fair value. Gains / (losses) on loan hedges includes the mark-to-market on the credit derivatives and the mark-to-market on the loans in the portfolio that are at fair value. In the second quarter 2022, gains / (losses) on loan hedges included $494 million related to Corporate Lending, compared to $(37) million in the prior-year period. The fixed premium costs of these hedges are netted against the Corporate Lending revenues to reflect the cost of credit protection. Citigroup's results of operations excluding the impact of gains / (losses) on loan hedges are non-GAAP financial measures.