
Third Quarter 2022 Results and Key Metrics
HIGHLIGHTS
- Returned $1.0 Billions in Dividends to Common Shareholders
- Payout Ratio of 31%3
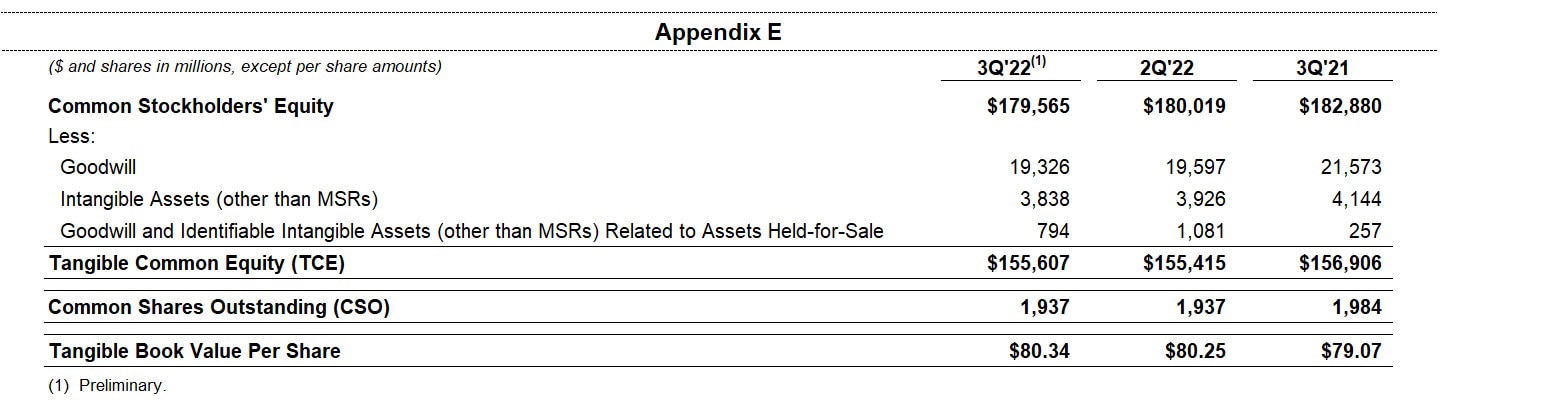
- Book Value per Share of $92.71
- Tangible Book Value per Share of $80.344
Read the full press release with tables and CEO commentary.
View the Financial Supplement (PDF)
View Financial Supplement (Excel)
New York – Citigroup Inc. today reported net income for the third quarter 2022 of $3.5 billion, or $1.63 per diluted share, on revenues of $18.5 billion. This compares to net income of $4.6 billion, or $2.15 per diluted share, on revenues of $17.4 billion for the third quarter 2021.
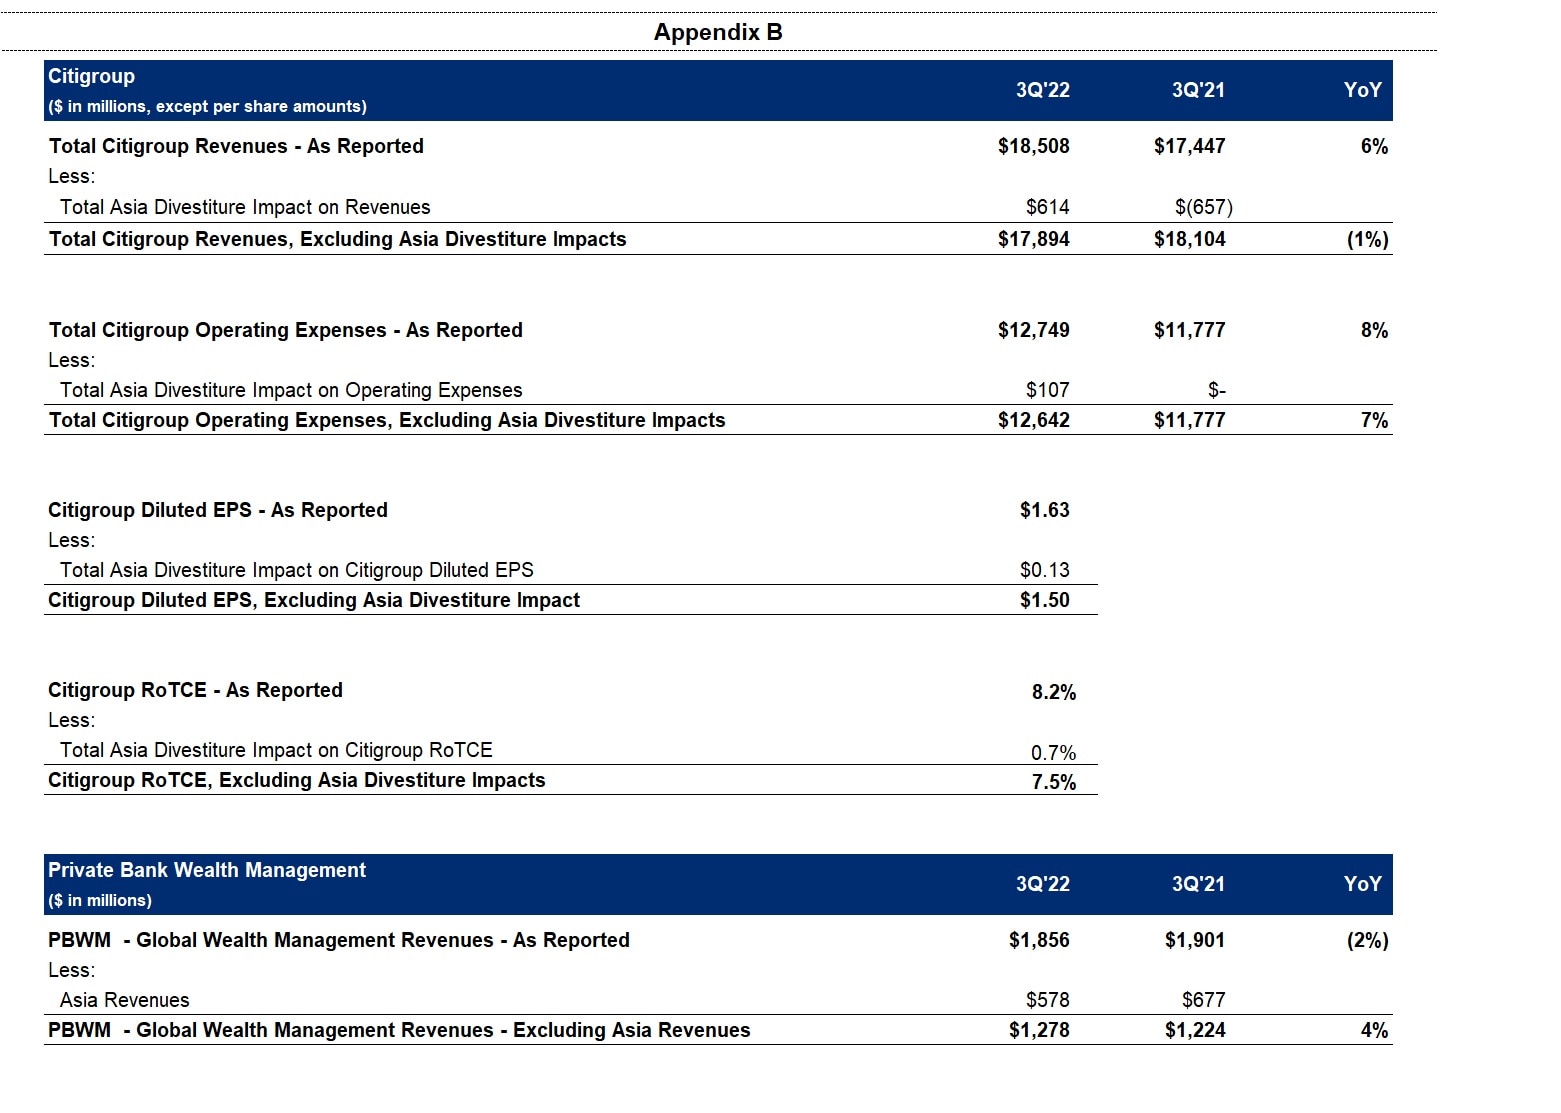
Third quarter results included Asia Consumer divestiture-related impacts of approximately $520 million in earnings before taxes (approximately $256 million after-tax), primarily driven by a gain on the sale of the Philippines consumer business. Excluding these divestiture-related impacts, earnings per share was $1.505.
Revenues increased 6% from the prior-year period, primarily due to the gain on sale of the Philippines consumer business versus a loss on sale of the Australia consumer business in the prior-year period. Excluding these divestiture-related impacts, revenues were down 1%5, as growth in net interest income was more than offset by lower non-interest revenues. On this basis, higher net interest income was driven by the impact of higher interest rates across businesses and strong loan growth in Personal Banking and Wealth Management (PBWM). This was more than offset by lower non-interest revenues reflecting declines in Investment Banking and Markets in Institutional Clients Group (ICG) and investment product revenues in Global Wealth Management in PBWM.
Net income of $3.5 billion decreased 25% from the prior-year period, primarily driven by higher cost of credit resulting from the loan growth in PBWM and higher operating expenses.
Earnings per share of $1.63 decreased 24% from the prior-year period, reflecting the lower net income, partially offset by an approximate 4% decline in average diluted shares outstanding.
Citi CEO Jane Fraser said, “We are intensely focused on supporting our clients and executing our strategy. We have made good progress on many of the core business drivers we laid out at Investor Day, despite the complex macro environment. Treasury and Trade Solutions saw revenues up 40% year-over-year, with growth across all segments, and Securities Services was up 15%. In Fixed Income, we matched last year’s showing through our strength in FX, while Equities came in lower than last year. Banking was the business most adversely impacted by the macro environment with reduced deal flows and a lower appetite for M&A. While the backdrop for wealth management was difficult, our revenues were up outside of Asia. U.S. Personal Banking further solidified its growth trajectory with double digit revenue growth in both of our cards businesses.
“We continue to shrink our operations in and exposure to Russia and we will be ending nearly all of the institutional banking services we offer next quarter. To be clear, our intention is to wind down our presence in this country.
“We returned $1 billion in capital to our shareholders and ended the quarter with a CET1 ratio of 12.2%, as we actively managed our RWA to improve the returns we generate for our shareholders. Given the strength of our balance sheet, capital levels and liquidity, we are well positioned to help our clients navigate very challenging markets and slower growth,” Ms. Fraser concluded.
Percentage comparisons throughout this press release are calculated for the third quarter 2022 versus the third quarter 2021, unless otherwise specified.
Update Regarding Citi’s Operations in Russia
As part of the previously announced intent of Citi to reduce its operations in and exposure to Russia, Citi is now informing its multinational clients in Russia that it will be ending nearly all of the institutional banking services it offers in Russia by the end of the first quarter of 2023. Going forward, Citi’s only operations in Russia will be those necessary to fulfill its remaining legal and regulatory obligations. At this time, Citi does not expect the costs to be incurred in connection with this action to be material. In August, Citi announced the wind down of its Russia consumer and local commercial banking businesses including the pursuit of portfolio sales.
Third Quarter Financial Results

Citigroup
Citigroup revenues of $18.5 billion in the third quarter 2022 increased 6%. Excluding the gain on sale of the Philippines consumer business in the quarter and the loss on sale of the Australia consumer business in the prior-year period, revenues were down 1%, as the impact of higher interest rates across businesses and strong loan growth in PBWM were more than offset by declines in Investment Banking and Markets and investment product revenues in Global Wealth Management.
Citigroup operating expenses of $12.7 billion in the third quarter 2022 increased 8%, largely driven by transformation investments, business-led investments, inflation and other risk and control initiatives and volume-related expenses, partially offset by productivity savings and the benefit of foreign exchange translation. Operating expenses included approximately $107 million of divestiture-related costs this quarter5. Excluding these costs, expenses increased 7%.
Citigroup cost of credit of $1.4 billion in the third quarter 2022, compared to $(0.2) billion in the prior-year period, reflecting a net build in the allowance for credit losses (ACL) for loans and unfunded commitments of $0.4 billion, primarily due to the loan growth in PBWM, compared to a net ACL release of $1.2 billion in the prior-year period, partially offset by lower net credit losses.
Citigroup net income of $3.5 billion in the third quarter 2022 decreased 25% from the prior-year period, primarily driven by the higher cost of credit and the higher expenses, partially offset by the increase in revenues. Citigroup’s effective tax rate was 20.0% in the current quarter versus 20.4% in the third quarter 2021.
Citigroup’s total allowance for credit losses on loans was approximately $16.3 billion at quarter end, with a reserve-to-funded loans ratio of 2.54%, compared to $17.7 billion, or 2.69% of funded loans, at the end of the prior-year period. Total non-accrual loans decreased 28% from the prior-year period to $2.9 billion. Consumer non-accrual loans decreased 25% to $1.4 billion and corporate non-accrual loans decreased 30% to $1.5 billion.
Citigroup's end-of-period loans were $646 billion at quarter end, down 3% versus the prior-year period, largely driven by the impact of foreign exchange translation and lower balances in Legacy Franchises.
Citigroup's end-of-period deposits were $1.3 trillion at quarter end, down 3% versus the prior-year period, largely driven by declines in Legacy Franchises and the impact of foreign exchange translation, partially offset by the issuance of institutional certificates of deposit, as Citigroup continues to diversify its funding profile.
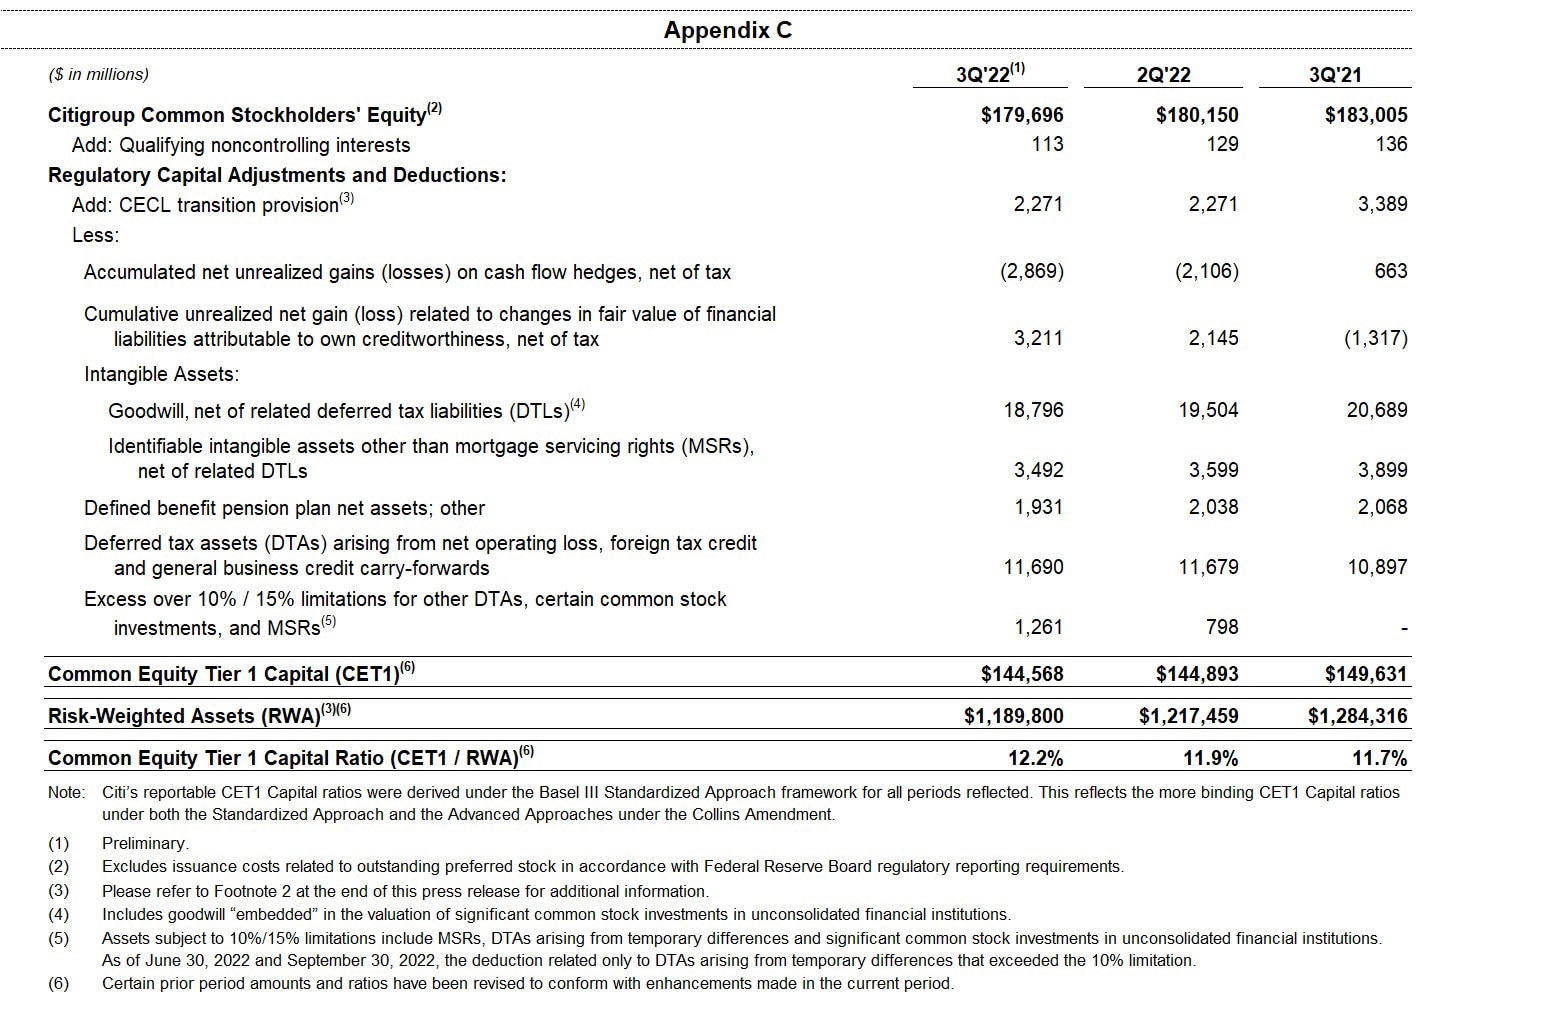
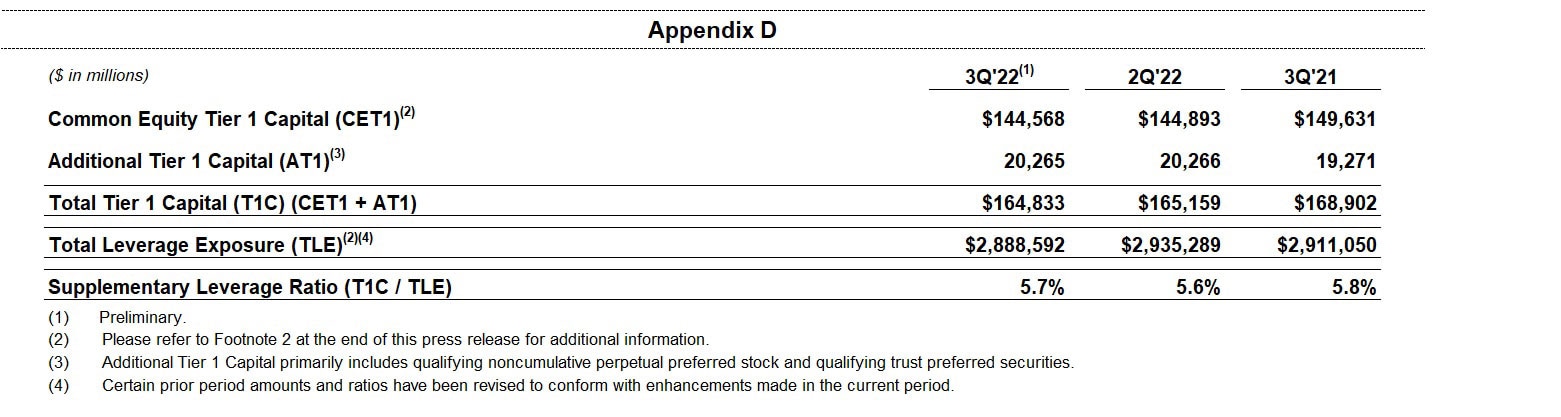
Citigroup's book value per share of $92.71 and tangible book value per share of $80.34 at quarter end increased 1% and 2%, respectively, largely driven by the net income and lower shares outstanding, partially offset by adverse movements in the accumulated other comprehensive income (AOCI) component of equity and common dividends. At quarter end, Citigroup’s CET1 Capital ratio was 12.2% versus 11.9% in the second quarter 2022, reflecting the benefits of the net income, the sale of the Philippines consumer business and the optimization of risk-weighted assets (RWA), partly offset by interest rate impacts on unrealized available-for-sale securities losses through Citigroup’s investment portfolio and changes in deferred tax assets. Citigroup’s Supplementary Leverage ratio for the third quarter 2022 was 5.7% versus 5.6% in the second quarter 2022. During the quarter, Citigroup returned a total of $1.0 billion to common shareholders in the form of dividends.
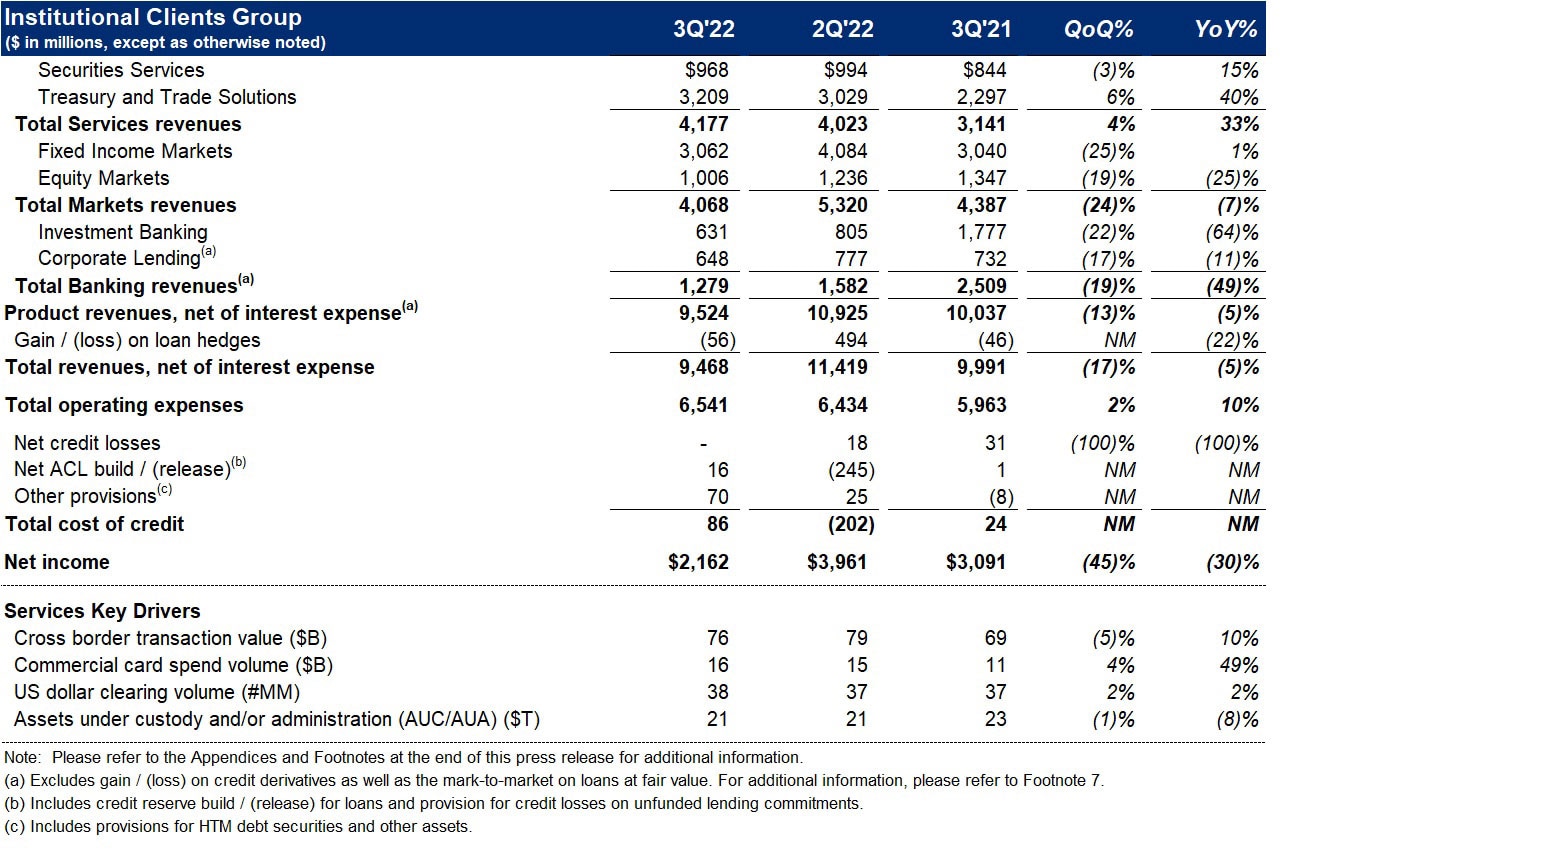
Institutional Clients Group
ICG revenues of $9.5 billion decreased 5% (including gain/(loss) on loan hedges)7, as strong revenue growth in Services was more than offset by lower revenues across Markets and Banking.
Services revenues of $4.2 billion increased 33%. Treasury and Trade Solutions (TTS) revenues of $3.2 billion increased 40%, driven by 61% growth in net interest income and 8% growth in non-interest revenue. Strong performance in TTS was driven by business actions, which included managing deposit repricing, deepening of relationships with existing clients, and significant new client wins across all segments, as well as the benefit of higher interest rates. Securities Services revenues of $968 million increased 15%, as net interest income increased 73%, driven by higher interest rates across currencies, partially offset by a 6% decrease in non-interest revenue due to the impact of market valuations.
Markets revenues of $4.1 billion were down 7%, largely driven by lower client activity levels in Equity Markets and spread products, and the optimization of RWA. Fixed Income Markets revenues of $3.1 billion increased 1%, as strength in rates and currencies was largely offset by continued headwinds in spread products. Equity Markets revenues of $1.0 billion were down 25%, primarily reflecting reduced client activity in equity derivatives relative to a very strong quarter in the prior-year period.
Banking revenues of $1.2 billion decreased 50%, including losses on loan hedges in the current quarter and the prior-year period. Excluding losses on loan hedges, Banking revenues of $1.3 billion decreased 49%, driven by lower revenues in Investment Banking and Corporate Lending. Investment Banking revenues of $631 million decreased 64%, as heightened macroeconomic uncertainty and volatility continued to impact client activity. Excluding losses on loan hedges, Corporate Lending revenues decreased 11% versus the prior-year period, driven by lower volumes and higher credit default swap premiums.
ICG operating expenses of $6.5 billion increased 10%, driven by transformation investments, business-led investments, and volume-related expenses, partially offset by productivity savings and foreign exchange translation.
ICG cost of credit of $86 million, compared to $24 million in the prior-year period, included a modest net ACL build for loans and unfunded commitments driven by macroeconomic uncertainty, which was mostly offset by a partial release of a COVID-19 related uncertainty reserve. Net credit losses for the quarter were nearly zero.
ICG net income of $2.2 billion decreased 30%, largely driven by the lower revenues, the higher expenses and the higher cost of credit.
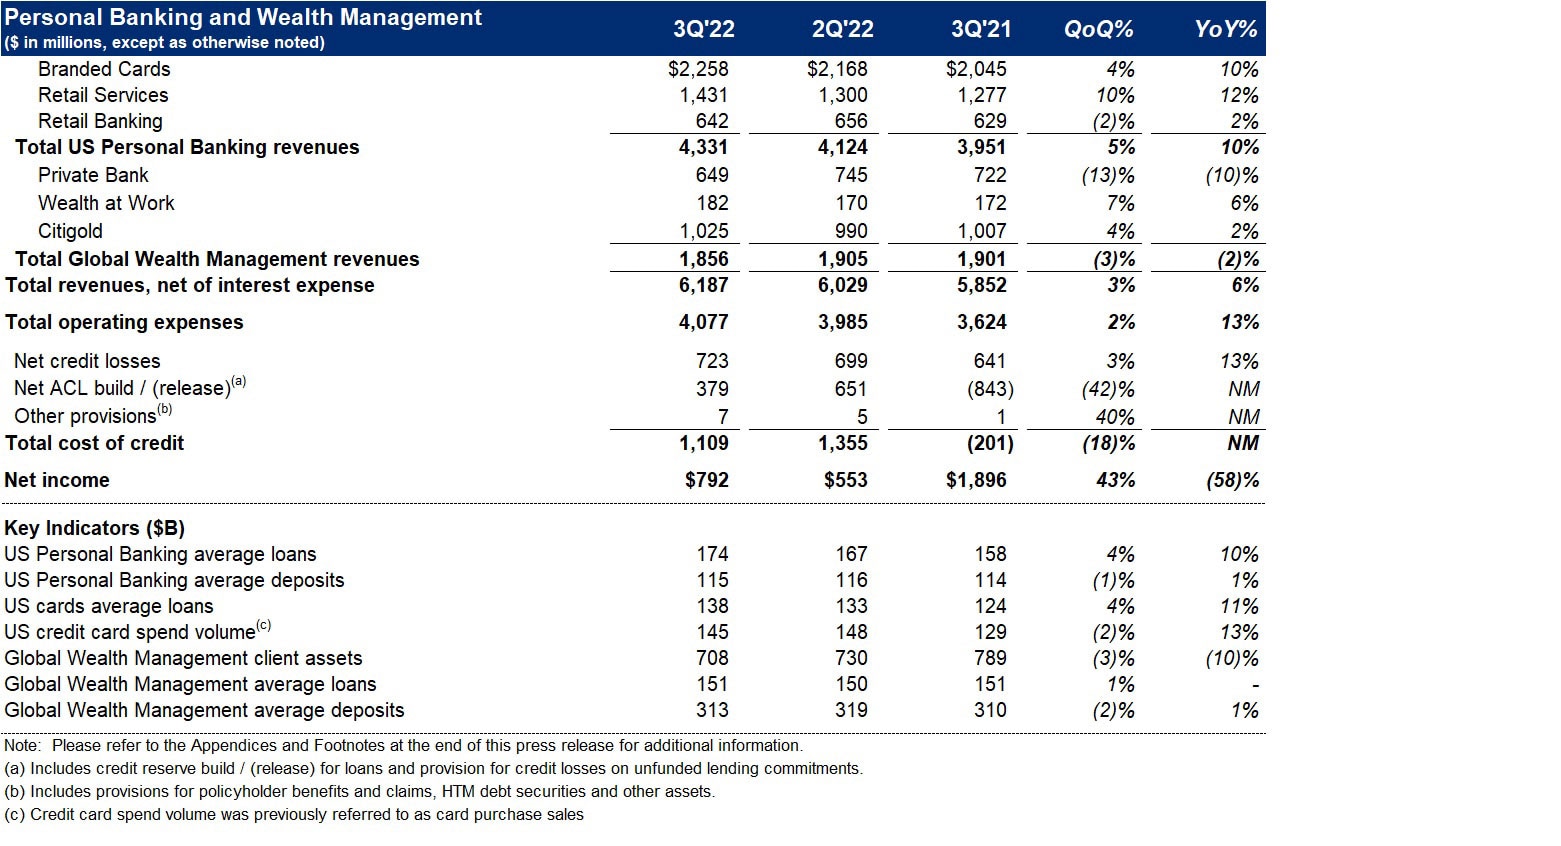
Personal Banking and Wealth Management
PBWM revenues of $6.2 billion increased 6%, as net interest income growth, driven by higher interest rates and strong loan growth across Branded Cards, Retail Services and Retail Banking, was partially offset by a decline in non-interest revenue, driven by lower investment fee revenues in Global Wealth Management and higher partner payments in Retail Services.
US Personal Banking revenues of $4.3 billion increased 10%. Branded Cards revenues of $2.3 billion increased 10%, driven by the higher net interest income. In Branded Cards, new account acquisitions increased 10%, card spend volumes increased 14% and average loans increased 12%. Retail Services revenues of $1.4 billion increased 12%, driven by the higher net interest income, partially offset by the higher partner payments. Retail Banking revenues of $642 million increased 2%, primarily driven by the higher interest rates and deposit growth.
Global Wealth Management revenues of $1.9 billion decreased 2%, as investment fee headwinds, particularly in Asia, more than offset net interest income growth from the higher interest rates. Excluding Asia8, revenues increased 4%.
PBWM operating expenses of $4.1 billion increased 13%, primarily driven by transformation investments, other risk and control initiatives, business-led investments and volume-driven expenses, partially offset by productivity savings.
PBWM cost of credit of $1.1 billion compared to $(0.2) billion in the prior-year period. The increase was largely driven by a net ACL build of $0.4 billion in the current quarter for loans and unfunded commitments, primarily driven by cards volume growth, compared to a net ACL release of $0.8 billion in the prior-year period for loans and unfunded commitments. Net credit losses of $723 million increased 13% from near historically low levels, reflecting ongoing normalization, particularly in Retail Services.
PBWM net income of $792 million decreased 58%, largely driven by the net ACL release in third quarter 2021, versus a net ACL build in the current quarter.
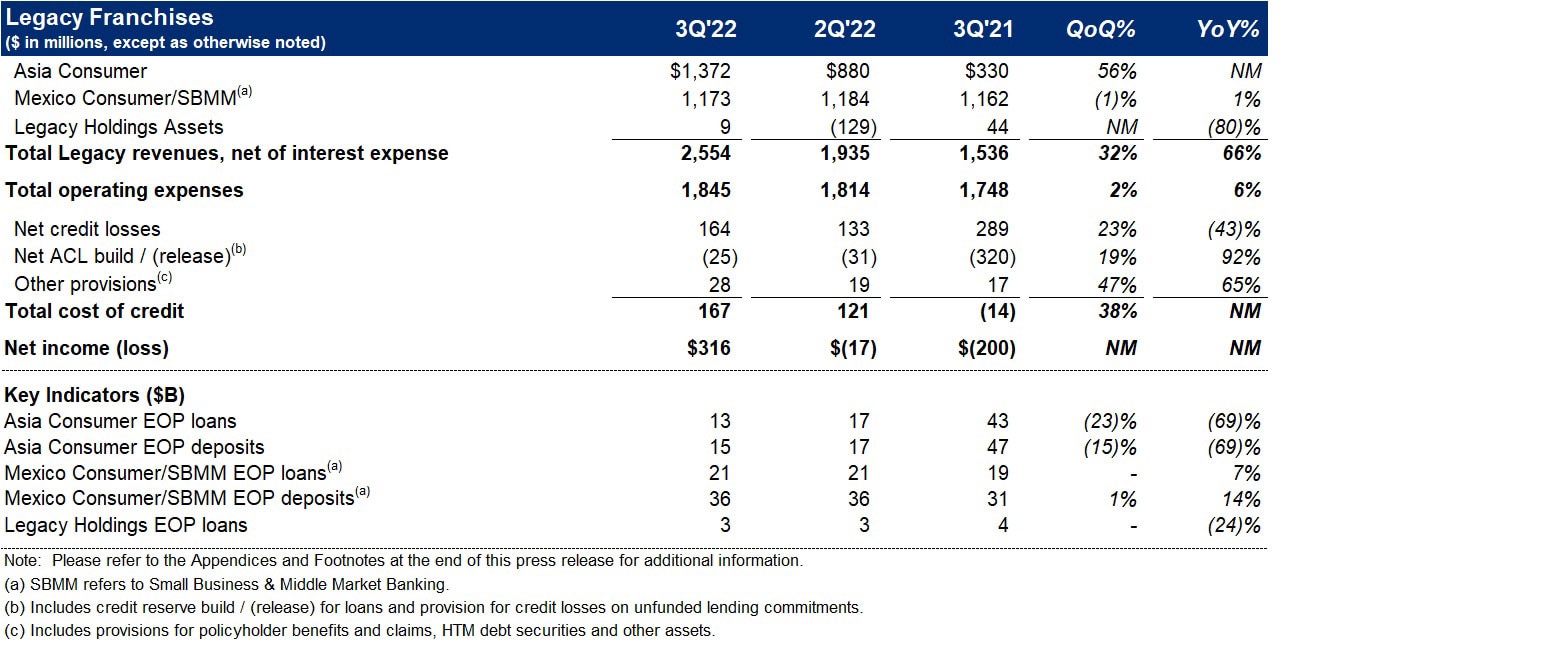
Legacy Franchises
Legacy Franchises revenues of $2.6 billion increased 66%, primarily driven by the Philippines consumer business gain on sale and the absence of the Australia consumer business loss on sale in the prior-year period, partially offset by the Korea wind-down as well as the impact of the Australia and the Philippines consumer exits.
Legacy Franchises expenses of $1.8 billion increased 6%, driven by divestiture-related costs in Asia and Mexico.
Legacy Franchises cost of credit of $167 million, compared to $(14) million in the prior-year period, primarily driven by a lower net ACL release in the current quarter for loans and unfunded commitments, partially offset by lower net credit losses.
Legacy Franchises net income of $316 million, compared to a net loss of $200 million in the prior-year period, primarily reflecting the Philippines gain on sale in the quarter and the Australia loss on sale in the prior-year period.
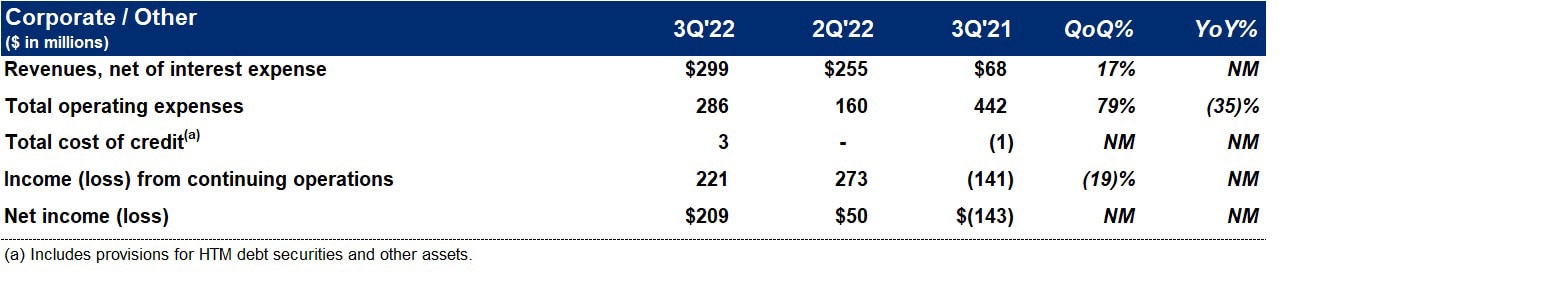
Corporate / Other
Corporate / Other revenues increased to $299 million from $68 million in the prior-year period, largely driven by higher net revenue from the investment portfolio due to higher interest rates, partially offset by mark-to-market on certain derivative transactions.
Corporate / Other expenses oof $286 million decreased 35%.
Corporate / Other income from continuing operations of $221 million, compared to a loss of $141 million in the prior-year period, reflecting the higher revenues and the lower expenses.
Citigroup will host a conference call today at 11 a.m. (ET). A live webcast of the presentation, as well as financial results and presentation materials, will be available at https://www.citigroup.com/global/investors. Dial-in numbers for the conference call are as follows: (800) 343-1703 (for U.S. and Canada callers) or (203) 518-9859 (for international callers).
Additional financial, statistical and business-related information, as well as business and segment trends, is included in a Quarterly Financial Data Supplement. Both this earnings release and Citigroup’s Third Quarter 2022 Quarterly Financial Data Supplement are available on Citigroup’s website at www.citigroup.com.
Citi
Citi is a preeminent banking partner for institutions with cross-border needs, a global leader in wealth management and a valued personal bank in its home market of the United States. Citi does business in more than 160 countries and jurisdictions, providing corporations, governments, investors, institutions and individuals with a broad range of financial products and services.
Additional information may be found at www.citigroup.com | Twitter: @Citi | YouTube: www.youtube.com/citi | Blog: http://blog.citigroup.com | Facebook: www.facebook.com/citi | LinkedIn: www.linkedin.com/company/citi
Certain statements in this release are “forward-looking statements” within the meaning of the rules and regulations of the Private Securities Litigation and Reform Act of 1995. These statements are based on management’s current expectations and are subject to uncertainty and changes in circumstances. These statements are not guarantees of future results or occurrences. Actual results and capital and other financial condition may differ materially from those included in these statements due to a variety of factors. These factors include, among others: the impacts related to or resulting from Russia’s military action in Ukraine, including the imposition of additional sanctions and export controls, as well as the broader impacts to financial markets and the global macroeconomic and geopolitical environments; higher inflation and its impacts; higher interest rates and the impacts on macroeconomic conditions, customer and client behavior, as well as Citi’s funding costs; macroeconomic and other challenges and uncertainties related to the COVID-19 pandemic, such as the impacts to the U.S. and global economies; consummation of Citi’s exits and wind-down, and the impact of any additional CTA or other losses; and the precautionary statements included in this release. These factors also consist of those contained in Citigroup’s filings with the U.S. Securities Exchange and Commission, including without limitation the “Risk Factors” section of Citigroup’s 2021 Form 10-K. Any forward-looking statements made by or on behalf of Citigroup speak only as to the date they are made, and Citi does not undertake to update forward-looking statements to reflect the impact of circumstances or events that arise after the date the forward-looking statements were made.
Contacts:
Investors: Jennifer Landis (212) 559-2718
Press: Danielle Romero-Apsilos (212) 816-2264
Click here for the complete press release and summary financial information.
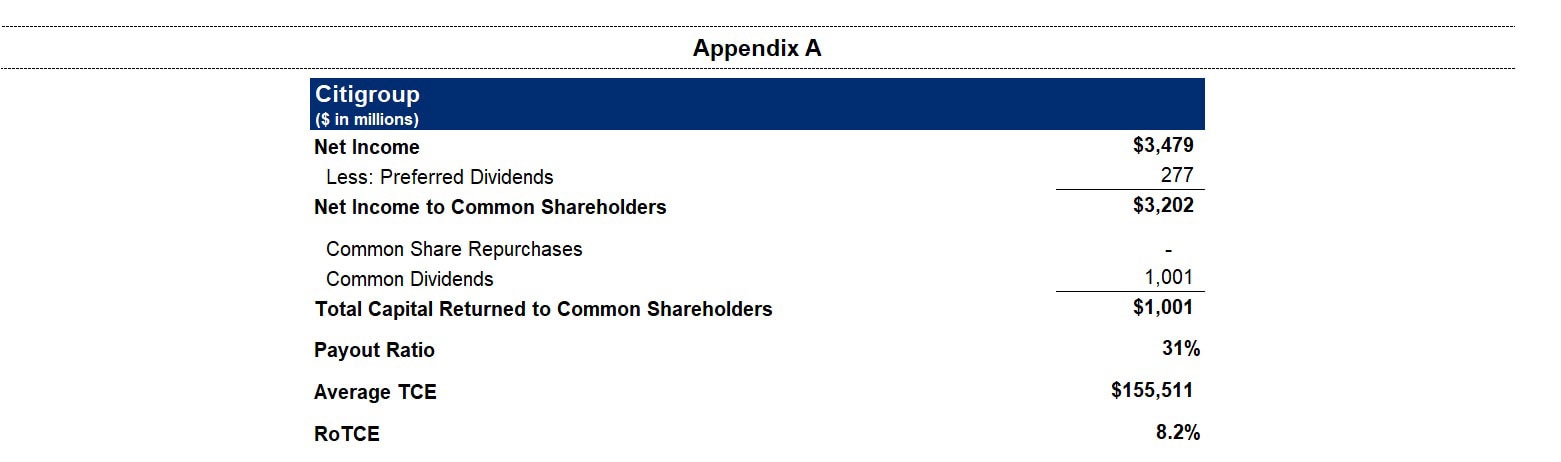
1 Preliminary. Citigroup’s return on average tangible common equity (RoTCE) is a non-GAAP financial measure. RoTCE represents annualized net income available to common shareholders as a percentage of average tangible common equity (TCE). For the components of the calculation, see Appendix A.
2 Ratios as of September 30, 2022 are preliminary. Citigroup’s Common Equity Tier 1 (CET1) Capital ratio and Supplementary Leverage ratio (SLR) reflect certain deferrals based on the modified regulatory capital transition provision related to the Current Expected Credit Losses (CECL) standard. Excluding these deferrals, Citigroup’s CET1 Capital ratio and SLR as of September 30, 2022 would be 11.9% and 5.6%, respectively, on a fully reflected basis. For additional information, please refer to the “Capital Resources” section of Citigroup’s 2021 Annual Report on Form 10-K. Certain prior-period amounts have been revised to conform with enhancements made in the current period.
For the composition of Citigroup’s CET1 Capital and ratio, see Appendix C. For the composition of Citigroup’s SLR, see Appendix D.
3 Citigroup’s payout ratio is the sum of common dividends and common share repurchases divided by net income available to common shareholders. For the components of the calculation, see Appendix A.
4 Citigroup’s tangible book value per share is a non-GAAP financial measure. For a reconciliation of this measure to reported results, see Appendix E.
5 Third quarter 2022 results included the impact of approximately $520 million in earnings before taxes (approximately $256 million after-tax) related to the sale of the Philippines consumer business and other Asia consumer exits, which primarily consisted of an approximate $616 million Philippines gain on sale recorded in Other revenue as well as an approximate $107 million of aggregate divestiture-related costs recorded in Operating expenses, both within Legacy Franchises. Third quarter 2021 results included Asia divestiture-related impacts of $657 million recorded in Other revenue within Legacy Franchises, primarily driven by a loss on sale of the Australia consumer business. Results of operations excluding the Philippines gain on sale or the Australia loss on sale are non-GAAP financial measures. For a reconciliation to reported results, please refer to Appendix B.
6 Second quarter 2022 discontinued operations reflect the release of a currency translation adjustment (CTA) loss (net of hedges) recorded in AOCI related to the substantial liquidation of a legal entity (with a non-U.S. dollar functional currency) that had previously divested a legacy business .
7 Credit derivatives are used to economically hedge a portion of the Corporate Loan portfolio that includes both accrual loans and loans at fair value. Gains / (losses) on loan hedges includes the mark-to-market on the credit derivatives and the mark-to-market on the loans in the portfolio that are at fair value. In the third quarter 2022, gains / (losses) on loan hedges included $(56) million related to Corporate Lending, compared to $(46) million in the prior-year period. The fixed premium costs of these hedges are netted against the Corporate Lending revenues to reflect the cost of credit protection. Citigroup’s results of operations excluding the impact of gains / (losses) on loan hedges are non-GAAP financial measures.
8 Global Wealth Management revenues in Asia were $578 million for the third quarter 2022 and $677 million for the third quarter 2021. Results of operations for Global Wealth Management excluding revenues in Asia are non-GAAP financial measures. For a reconciliation to reported results, please refer to Appendix B .